Weekly Time-Frame: Key Levels (Pivot-Based)
Using weekly pivot-point analysis from TopStockResearch:
Resistance Levels:
R1 (Standard): ₹7,878.33
R2 (Standard): ₹8,366.67
R3 (Standard): ₹8,653.83
Pivot Point (PP): ₹7,591.17
Support Levels:
S1 (Standard): ₹7,102.83
S2 (Standard): ₹6,815.67
S3 (Standard): ₹6,327.33
This gives a broad weekly trading range: ₹6,327 – ₹8,654.
Weekly Outlook (EquityPandit as of Sept 1–5, 2025)
Immediate Support: ₹7,102.83
Immediate Resistance: ₹7,878.33
Secondary Support: ₹6,815.67
Secondary Resistance: ₹8,366.67
Extended Range (week’s extremes): ₹6,327.33 – ₹8,653.83
Intraday to Short-Term Levels (EquityPandit)
Support Zones: ₹7,548 – ₹7,302 – ₹7,166
Resistance Zones: ₹7,929 – ₹8,065 – ₹8,311
Interpretation & Strategy
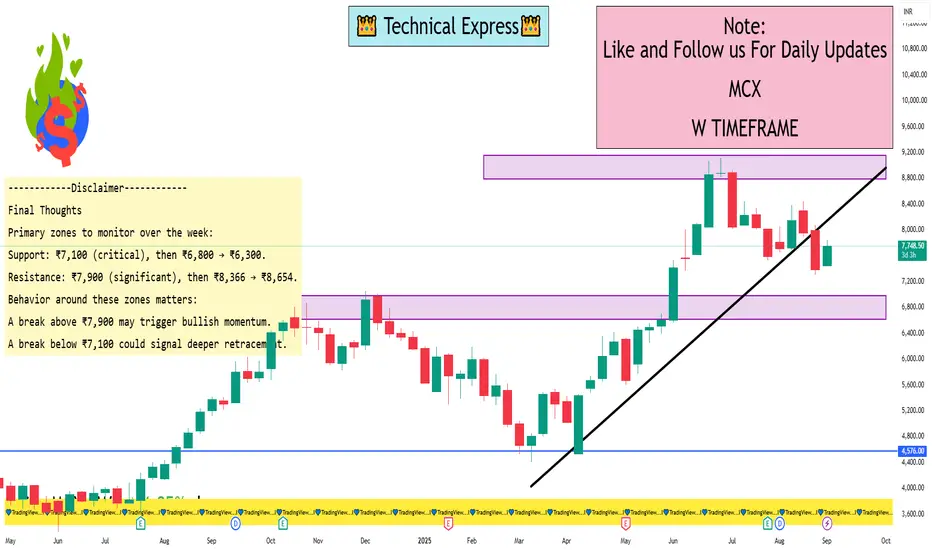
Key Weekly Range: ₹7,100 – ₹7,900.
Holding above ₹7,100 indicates potential to rally toward ₹7,900–₹8,000, with further resistance toward ₹8,366–8,654.
A break below ₹7,100 could expose downside risk to ₹6,800, and possibly ₹6,300 if weakness intensifies.
Aggressive traders may watch:
Short-term range: ₹7,300–₹7,550 (support) vs ₹7,900–₹8,300 (resistance).
Pivot point note: Weekly pivots are derived from previous weeks’ price action using high, low, and close, and provide leading signals for potential reversal or breakout zones
Using weekly pivot-point analysis from TopStockResearch:
Resistance Levels:
R1 (Standard): ₹7,878.33
R2 (Standard): ₹8,366.67
R3 (Standard): ₹8,653.83
Pivot Point (PP): ₹7,591.17
Support Levels:
S1 (Standard): ₹7,102.83
S2 (Standard): ₹6,815.67
S3 (Standard): ₹6,327.33
This gives a broad weekly trading range: ₹6,327 – ₹8,654.
Weekly Outlook (EquityPandit as of Sept 1–5, 2025)
Immediate Support: ₹7,102.83
Immediate Resistance: ₹7,878.33
Secondary Support: ₹6,815.67
Secondary Resistance: ₹8,366.67
Extended Range (week’s extremes): ₹6,327.33 – ₹8,653.83
Intraday to Short-Term Levels (EquityPandit)
Support Zones: ₹7,548 – ₹7,302 – ₹7,166
Resistance Zones: ₹7,929 – ₹8,065 – ₹8,311
Interpretation & Strategy
Key Weekly Range: ₹7,100 – ₹7,900.
Holding above ₹7,100 indicates potential to rally toward ₹7,900–₹8,000, with further resistance toward ₹8,366–8,654.
A break below ₹7,100 could expose downside risk to ₹6,800, and possibly ₹6,300 if weakness intensifies.
Aggressive traders may watch:
Short-term range: ₹7,300–₹7,550 (support) vs ₹7,900–₹8,300 (resistance).
Pivot point note: Weekly pivots are derived from previous weeks’ price action using high, low, and close, and provide leading signals for potential reversal or breakout zones
I built a Buy & Sell Signal Indicator with 85% accuracy.
📈 Get access via DM or
WhatsApp: wa.link/d997q0
Contact - +91 76782 40962
| Email: techncialexpress@gmail.com
| Script Coder | Trader | Investor | From India
📈 Get access via DM or
WhatsApp: wa.link/d997q0
Contact - +91 76782 40962
| Email: techncialexpress@gmail.com
| Script Coder | Trader | Investor | From India
Publikasi terkait
Pernyataan Penyangkalan
The information and publications are not meant to be, and do not constitute, financial, investment, trading, or other types of advice or recommendations supplied or endorsed by TradingView. Read more in the Terms of Use.