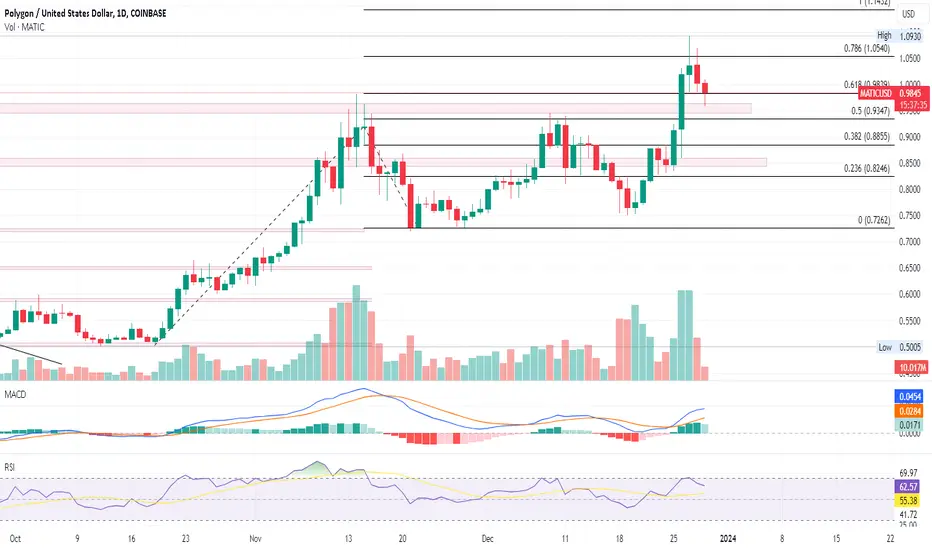
Current Scenario: MATIC price recently experienced a bullish breakout but is currently undergoing a retest of the $0.96 level.
Recent Performance: After a strong 35% rise in just a week, MATIC's price struggles to maintain above the key $1 mark.
Retest Dynamics: The ongoing retest is characterized by lower price rejection, hinting at a possible successful retest.
Future Prospects: Post-retest, MATIC could potentially continue its bullish run, aiming for the $1.50 milestone.
Technical Snapshot: MATIC's price has shown resilience, bouncing back to $0.9855, limiting its intraday fall to 1.81%.
Volume Analysis: Reduced trading volume during the retest phase may augment the chances of a bullish reversal.
Technical Indicators:
MACD: Indicates sustained positive alignment despite a slight dip in bullish momentum.
EMAs: The bullish crossover between the 50-day and 200-day EMAs suggests potential dynamic support.
Fibonacci Levels: Trend-based Fibonacci extension points to possible targets at $1.20, followed by $1.50.
Downside Risks: A fall below the $0.96 level could amplify selling pressure, potentially testing the $0.90 mark.
Overall Outlook: The MATIC price analysis remains optimistic for early 2024, with signs pointing towards a significant rally if the current retest phase concludes successfully.
Pernyataan Penyangkalan
Informasi dan publikasi tidak dimaksudkan untuk menjadi, dan bukan merupakan saran keuangan, investasi, perdagangan, atau rekomendasi lainnya yang diberikan atau didukung oleh TradingView. Baca selengkapnya di Persyaratan Penggunaan.
Pernyataan Penyangkalan
Informasi dan publikasi tidak dimaksudkan untuk menjadi, dan bukan merupakan saran keuangan, investasi, perdagangan, atau rekomendasi lainnya yang diberikan atau didukung oleh TradingView. Baca selengkapnya di Persyaratan Penggunaan.