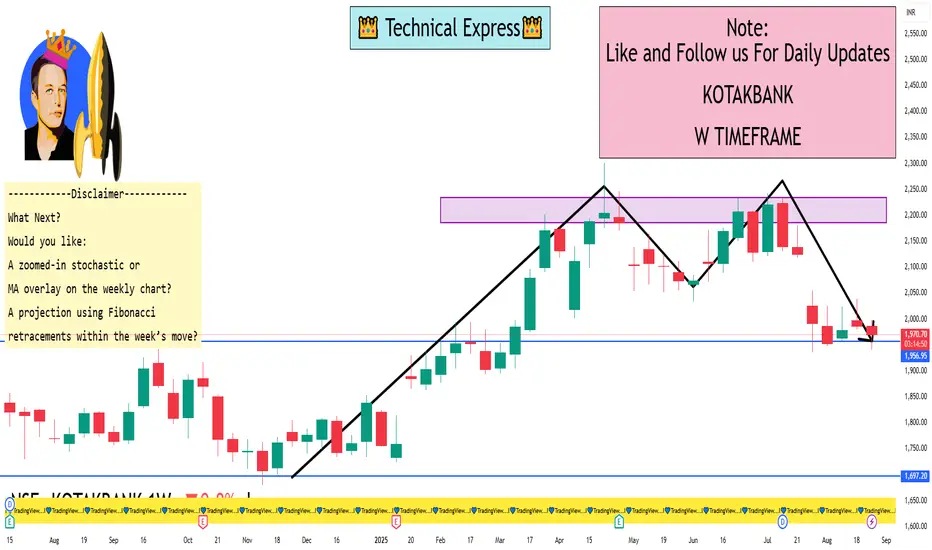
Weekly Technical Levels & Analysis
Pivot-Based Levels (from TopStockResearch)
Weekly Support Zones (Standard pivots):
S1: ₹1,964.87
S2: ₹1,943.13
S3: ₹1,906.07
Weekly Resistance Zones:
R1: ₹2,001.93
R2: ₹2,060.73
R3: ₹2,082.47
These pivot levels often act as short-term barriers and support and can help anticipate price behavior within the current weekly range.
Elliott Wave Analysis (from FXStreet)
The stock appears to be beginning Wave 3 in an Elliott Wave count—typically the strongest impulse phase.
The invalidating level for this bullish count is pegged at ₹1,681. As long as the price stays above this, the bullish structure remains valid.
This suggests strong upward potential in the medium term.
I built a Buy & Sell Signal Indicator with 85% accuracy.
📈 Get access via DM or
WhatsApp: wa.link/d997q0
| Email: techncialexpress@gmail.com
| Script Coder | Trader | Investor | From India
📈 Get access via DM or
WhatsApp: wa.link/d997q0
| Email: techncialexpress@gmail.com
| Script Coder | Trader | Investor | From India
Publikasi terkait
Pernyataan Penyangkalan
Informasi dan publikasi tidak dimaksudkan untuk menjadi, dan bukan merupakan saran keuangan, investasi, perdagangan, atau rekomendasi lainnya yang diberikan atau didukung oleh TradingView. Baca selengkapnya di Persyaratan Penggunaan.