📈 Technical Indicators (Daily Time Frame)
Overall Signal: Strong Buy
Moving Averages:
5-day: ₹1,113.28 (Sell)
50-day: ₹1,099.71 (Buy)
200-day: ₹1,087.01 (Buy)
Fibonacci Pivot Point: ₹1,114.13
Relative Strength Index (RSI): 52.5 — Neutral
MACD: +2.82 — Bullish
Technical Indicators: 3 Buy, 2 Sell
These indicators suggest a continuation of the current upward momentum, though the neutral RSI indicates caution against overbought conditions.
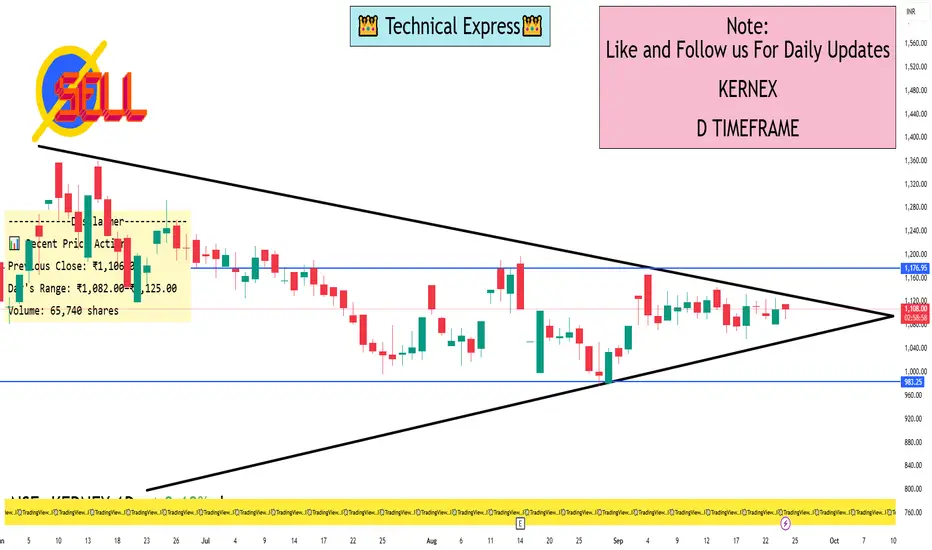
📊 Recent Price Action
The stock closed at ₹1,106.00 on September 23, 2025, marking a 0.89% increase from the previous day. The day's range was ₹1,082.00–₹1,125.00, with a volume of 65,740 shares.
🔮 Price Forecast
Short-term forecasts suggest a potential pullback to ₹1,075.70, possibly due to profit-taking or market consolidation.
📌 Conclusion
Kernex Microsystems India Ltd is currently in a strong bullish phase on the daily chart, supported by favorable moving averages and MACD. However, the neutral RSI and short-term price forecasts indicate a need for caution. Investors should monitor for any signs of reversal or consolidation before making further decisions.
Overall Signal: Strong Buy
Moving Averages:
5-day: ₹1,113.28 (Sell)
50-day: ₹1,099.71 (Buy)
200-day: ₹1,087.01 (Buy)
Fibonacci Pivot Point: ₹1,114.13
Relative Strength Index (RSI): 52.5 — Neutral
MACD: +2.82 — Bullish
Technical Indicators: 3 Buy, 2 Sell
These indicators suggest a continuation of the current upward momentum, though the neutral RSI indicates caution against overbought conditions.
📊 Recent Price Action
The stock closed at ₹1,106.00 on September 23, 2025, marking a 0.89% increase from the previous day. The day's range was ₹1,082.00–₹1,125.00, with a volume of 65,740 shares.
🔮 Price Forecast
Short-term forecasts suggest a potential pullback to ₹1,075.70, possibly due to profit-taking or market consolidation.
📌 Conclusion
Kernex Microsystems India Ltd is currently in a strong bullish phase on the daily chart, supported by favorable moving averages and MACD. However, the neutral RSI and short-term price forecasts indicate a need for caution. Investors should monitor for any signs of reversal or consolidation before making further decisions.
I built a Buy & Sell Signal Indicator with 85% accuracy.
📈 Get access via DM or
WhatsApp: wa.link/d997q0
Contact - +91 76782 40962
| Email: techncialexpress@gmail.com
| Script Coder | Trader | Investor | From India
📈 Get access via DM or
WhatsApp: wa.link/d997q0
Contact - +91 76782 40962
| Email: techncialexpress@gmail.com
| Script Coder | Trader | Investor | From India
Publikasi terkait
Pernyataan Penyangkalan
Informasi dan publikasi ini tidak dimaksudkan, dan bukan merupakan, saran atau rekomendasi keuangan, investasi, trading, atau jenis lainnya yang diberikan atau didukung oleh TradingView. Baca selengkapnya di Ketentuan Penggunaan.