ITDC (India Tourism Development Corp Ltd) Weekly Chart Analysis
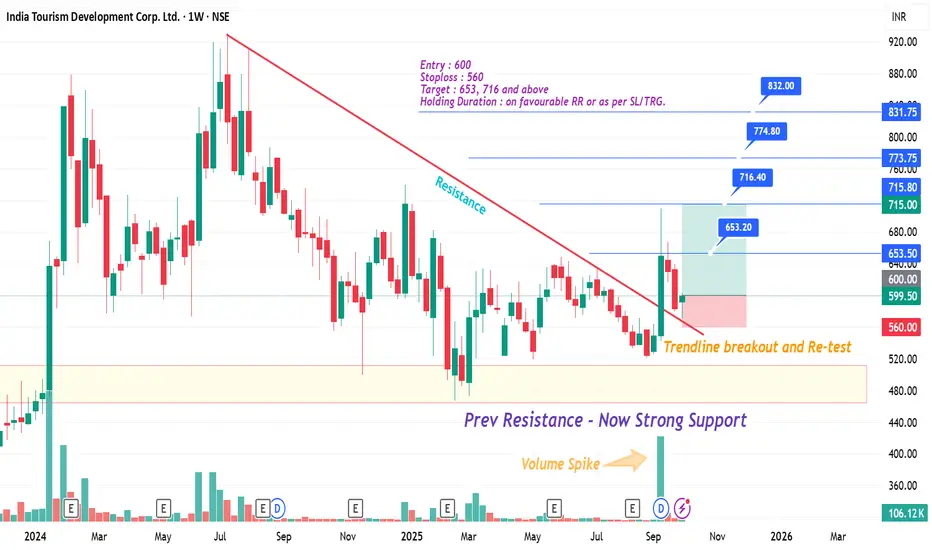
The stock has shown a trendline breakout and successful retest with strong volume support, indicating bullish momentum building up.
✅ Entry: 600
❌ Stoploss: 560
🎯 Targets: 653, 716, 774, 832
🔹 Previous resistance zone is now acting as strong support.
🔹 Volume spike confirms buying interest.
🔹 Risk-Reward looks favorable for positional traders.
This setup aligns with the tourism & hospitality sector’s ongoing revival and government focus on boosting domestic tourism.
Watchlist Addition 🚀
If momentum sustains, higher levels are possible in the medium term.
📰 Why should add :
Government initiatives to promote domestic tourism.
Upcoming festive and holiday season expected to boost travel demand.
Hospitality & tourism sector showing strong recovery trends post-pandemic.
#ITDC #Tourism #Hospitality #BreakoutStocks #SwingTrade #PositionalTrade #NSEStocks #ChartAnalysis #VolumeBreakout
Pernyataan Penyangkalan
Informasi dan publikasi tidak dimaksudkan untuk menjadi, dan bukan merupakan saran keuangan, investasi, perdagangan, atau rekomendasi lainnya yang diberikan atau didukung oleh TradingView. Baca selengkapnya di Persyaratan Penggunaan.
Pernyataan Penyangkalan
Informasi dan publikasi tidak dimaksudkan untuk menjadi, dan bukan merupakan saran keuangan, investasi, perdagangan, atau rekomendasi lainnya yang diberikan atau didukung oleh TradingView. Baca selengkapnya di Persyaratan Penggunaan.