📊 1-Hour Timeframe: Key Levels
🔹 Support Levels
Immediate Support: ₹1,363.14
Key Support Zones: ₹1,352.93, ₹1,333.87
🔹 Resistance Levels
Immediate Resistance: ₹1,367.07
Key Resistance Zones: ₹1,385.23, ₹1,398.47
These levels are derived from standard pivot point calculations and are commonly used by traders to identify potential reversal points within the trading day.
📈 Technical Indicators (1-Hour Chart)
Relative Strength Index (RSI): 37.26 — indicates the stock is nearing oversold conditions, suggesting potential for a price rebound.
Moving Average Convergence Divergence (MACD): -16.11 — a negative value, which may indicate bearish momentum.
Average Directional Index (ADX): 23.81 — suggests a weak trend, implying indecision in the market.
Stochastic Oscillator: 13.21 — indicates the stock is oversold, potentially signaling a reversal.
Supertrend Indicator: ₹1,398.34 — indicates a bearish trend.
These indicators collectively suggest a bearish short-term outlook, with potential for a reversal if support levels hold.
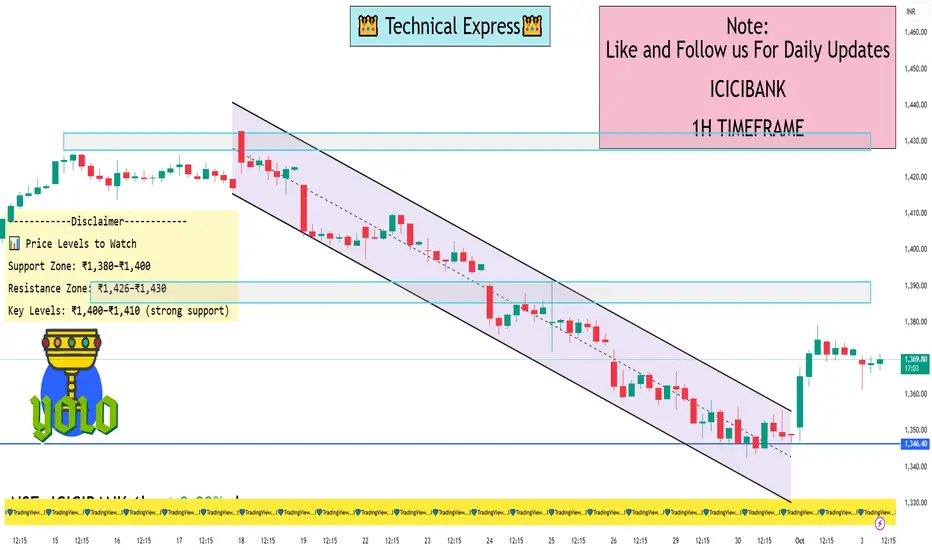
📊 Price Levels to Watch
Support Zone: ₹1,380–₹1,400
Resistance Zone: ₹1,426–₹1,430
Key Levels: ₹1,400–₹1,410 (strong support)
🔄 Summary
ICICI Bank Ltd. is currently trading near its support levels on the 1-hour chart. The RSI indicates potential oversold conditions, while other indicators suggest a weak bearish trend. Traders should monitor the key support and resistance levels mentioned above for potential breakout or breakdown scenarios.
🔹 Support Levels
Immediate Support: ₹1,363.14
Key Support Zones: ₹1,352.93, ₹1,333.87
🔹 Resistance Levels
Immediate Resistance: ₹1,367.07
Key Resistance Zones: ₹1,385.23, ₹1,398.47
These levels are derived from standard pivot point calculations and are commonly used by traders to identify potential reversal points within the trading day.
📈 Technical Indicators (1-Hour Chart)
Relative Strength Index (RSI): 37.26 — indicates the stock is nearing oversold conditions, suggesting potential for a price rebound.
Moving Average Convergence Divergence (MACD): -16.11 — a negative value, which may indicate bearish momentum.
Average Directional Index (ADX): 23.81 — suggests a weak trend, implying indecision in the market.
Stochastic Oscillator: 13.21 — indicates the stock is oversold, potentially signaling a reversal.
Supertrend Indicator: ₹1,398.34 — indicates a bearish trend.
These indicators collectively suggest a bearish short-term outlook, with potential for a reversal if support levels hold.
📊 Price Levels to Watch
Support Zone: ₹1,380–₹1,400
Resistance Zone: ₹1,426–₹1,430
Key Levels: ₹1,400–₹1,410 (strong support)
🔄 Summary
ICICI Bank Ltd. is currently trading near its support levels on the 1-hour chart. The RSI indicates potential oversold conditions, while other indicators suggest a weak bearish trend. Traders should monitor the key support and resistance levels mentioned above for potential breakout or breakdown scenarios.
I built a Buy & Sell Signal Indicator with 85% accuracy.
📈 Get access via DM or
WhatsApp: wa.link/d997q0
Contact - +91 76782 40962
| Email: techncialexpress@gmail.com
| Script Coder | Trader | Investor | From India
📈 Get access via DM or
WhatsApp: wa.link/d997q0
Contact - +91 76782 40962
| Email: techncialexpress@gmail.com
| Script Coder | Trader | Investor | From India
Publikasi terkait
Pernyataan Penyangkalan
Informasi dan publikasi ini tidak dimaksudkan, dan bukan merupakan, saran atau rekomendasi keuangan, investasi, trading, atau jenis lainnya yang diberikan atau didukung oleh TradingView. Baca selengkapnya di Ketentuan Penggunaan.