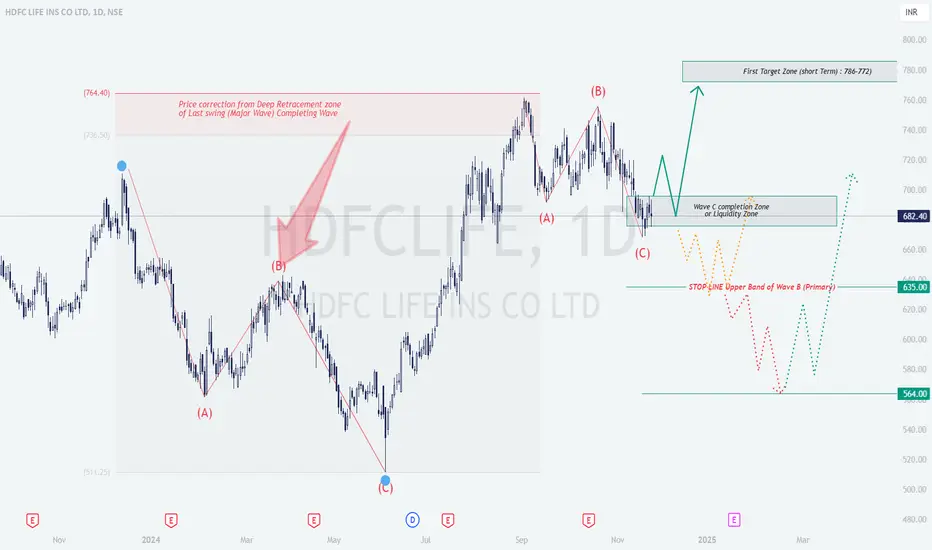
[1] Understanding the Current Setup
The chart reflects a corrective Elliott Wave structure (ABC pattern):
Wave A: Initial decline from the peak of ₹764.40.
Wave B: Pullback to a resistance zone after Wave A.
Wave C: Continuation of the downtrend, nearing a potential completion zone or liquidity zone around ₹670-680.
The stock is currently consolidating near this Wave C completion zone, signaling a possible reversal to the upside.
[2] Trade Setup Explanation
[3] Technical Analysis Insights
Fibonacci Levels: Wave B retraced deeply (likely 61.8%-78.6% of Wave A). Wave C aligns with extensions (1x or 1.618x of Wave A).
Liquidity Zone: The ₹670-682 zone is a demand area where institutional buying might occur. Look for bullish candlestick patterns for confirmation.
Target Zone: ₹772-786 is a key resistance area, ideal for profit-taking in a bullish scenario.
Stop-Loss Placement: Logical stops are set below the invalidation levels (~₹635 for bulls, ~₹680 for bears).
[4] Prediction and Plan
[5] Educational Takeaway
Elliott Wave Application: Highlights an ABC correction and potential reversal.
Risk Management: Use stop losses at key invalidation levels to minimize risks.
Confirmation Tools: Enhance reliability using indicators like RSI divergence, MACD crossovers, or volume spikes.
Patience: Wait for price action confirmation before entering trades.
This structured plan ensures adaptability to both bullish and bearish scenarios while maintaining disciplined risk management.
The chart reflects a corrective Elliott Wave structure (ABC pattern):
Wave A: Initial decline from the peak of ₹764.40.
Wave B: Pullback to a resistance zone after Wave A.
Wave C: Continuation of the downtrend, nearing a potential completion zone or liquidity zone around ₹670-680.
The stock is currently consolidating near this Wave C completion zone, signaling a possible reversal to the upside.
[2] Trade Setup Explanation
- Bullish Setup:Logic: If Wave C concludes within the Liquidity Zone (~₹670-682), an upward reversal is anticipated toward the first target zone at ₹772-786.
Entry Point: Enter after a clear breakout or reversal signal (e.g., bullish candlestick, trendline breakout, or volume spike).
Targets:
- Target 1: ₹772-786.
- Target 2: Further upside based on price action.
Stop Loss: Below the Wave C lower boundary (~₹635). - Bearish Setup (Alternate Scenario):Logic: A breakdown below ₹635 suggests further downside.
Entry Point: Short on confirmation of a breach below ₹635.
Target: Next support zone at ₹564.
Stop Loss: Above the Liquidity Zone (~₹680).
[3] Technical Analysis Insights
Fibonacci Levels: Wave B retraced deeply (likely 61.8%-78.6% of Wave A). Wave C aligns with extensions (1x or 1.618x of Wave A).
Liquidity Zone: The ₹670-682 zone is a demand area where institutional buying might occur. Look for bullish candlestick patterns for confirmation.
Target Zone: ₹772-786 is a key resistance area, ideal for profit-taking in a bullish scenario.
Stop-Loss Placement: Logical stops are set below the invalidation levels (~₹635 for bulls, ~₹680 for bears).
[4] Prediction and Plan
- []Primary Scenario (Bullish): Wave C completes in the Liquidity Zone, leading to a reversal targeting ₹772-786.
[]Alternate Scenario (Bearish): Breakdown below ₹635 invalidates the bullish outlook, with potential downside to ₹564.
[5] Educational Takeaway
Elliott Wave Application: Highlights an ABC correction and potential reversal.
Risk Management: Use stop losses at key invalidation levels to minimize risks.
Confirmation Tools: Enhance reliability using indicators like RSI divergence, MACD crossovers, or volume spikes.
Patience: Wait for price action confirmation before entering trades.
This structured plan ensures adaptability to both bullish and bearish scenarios while maintaining disciplined risk management.
Pernyataan Penyangkalan
Informasi dan publikasi tidak dimaksudkan untuk menjadi, dan bukan merupakan saran keuangan, investasi, perdagangan, atau rekomendasi lainnya yang diberikan atau didukung oleh TradingView. Baca selengkapnya di Persyaratan Penggunaan.
Pernyataan Penyangkalan
Informasi dan publikasi tidak dimaksudkan untuk menjadi, dan bukan merupakan saran keuangan, investasi, perdagangan, atau rekomendasi lainnya yang diberikan atau didukung oleh TradingView. Baca selengkapnya di Persyaratan Penggunaan.