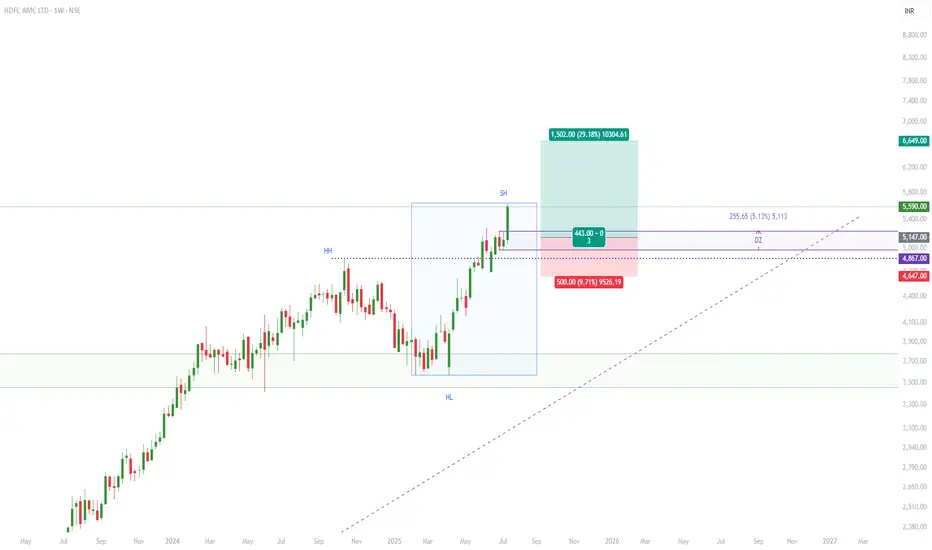
STOCK TREND - BULLISH
MULTI TF ANALYSIS
==================
MONTHLY - Strong Uptrend
WEEKLY - Recent BoS breakout after consolidation
DAILY - NA
TECHNICAL ANALYSIS
===================
Stock Price is trading above [50, 100, 200] SMAs
RSI > [60]
Support/Resistance Zone - [4700 - 4864]
Demand Zone - [4984 - 5233.50]
Observation - Recent BoS breakout has been confirmed along with RSI and Volume confirmation on WEEKLY chart.
FUNDAMENTAL ANALYSIS
======================
Compounded Sales Growth - [33%]
Compounded Profit Growth - [26%]
Stock Price CAGR - [37%]
Return on Equity - [32%]
Note: The stock is currently fairly valued as Stock PE(29.05) > Industry PE(19.66).
POTENTIAL TRADE PLAN
=============
ENTRY - [5147]
SL - [4647]
TARGET - [6649]
RRR - [1:3]
Disclaimer: This chart study is for educational purpose only. Please don't consider this as an advice and kindly trade at your own risk.
Pernyataan Penyangkalan
Informasi dan publikasi tidak dimaksudkan untuk menjadi, dan bukan merupakan saran keuangan, investasi, perdagangan, atau rekomendasi lainnya yang diberikan atau didukung oleh TradingView. Baca selengkapnya di Persyaratan Penggunaan.
Pernyataan Penyangkalan
Informasi dan publikasi tidak dimaksudkan untuk menjadi, dan bukan merupakan saran keuangan, investasi, perdagangan, atau rekomendasi lainnya yang diberikan atau didukung oleh TradingView. Baca selengkapnya di Persyaratan Penggunaan.