📌 Current Price
The stock is trading around ₹4,748 – ₹4,862 on the NSE.
The 52-week range is about ₹3,046 (low) and ₹5,165 (high).
🔍 Weekly Pivot / Support / Resistance Zones
According to one pivot-point table: Weekly Standard pivot for HAL:
Pivot ~ ₹4,762.50
Support levels: ~ ₹4,604, ₹4,478
Resistance levels: ~ ₹4,888, ₹5,046
From a technical analysis site: Weekly S1 around ₹4,530, S2 around ₹4,433; R1 ~ ₹4,719, R2 ~ ₹4,811.
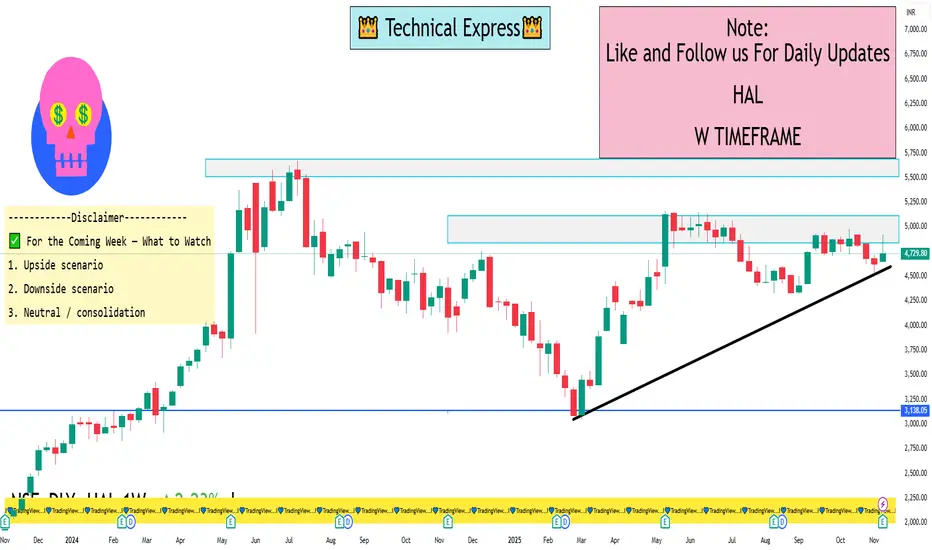
✅ For the Coming Week — What to Watch
Upside scenario: If HAL holds above ~ ₹4,760 (the weekly pivot area) and breaks above ~ ₹4,888-₹5,000, the next target zone could be ~ ₹5,000-₹5,100+ (within this week) given its proximity to recent 52-week highs.
Downside scenario: If it fails to hold the pivot ~ ₹4,760 and slides below ~ ₹4,600-₹4,500, then support zones ~ ₹4,478 and ~ ₹4,433 come into play. A break below those could open more downside.
Neutral / consolidation: It may also trade sideways between ~ ₹4,600 and ~ ₹4,900 until a catalyst drives a breakout.
The stock is trading around ₹4,748 – ₹4,862 on the NSE.
The 52-week range is about ₹3,046 (low) and ₹5,165 (high).
🔍 Weekly Pivot / Support / Resistance Zones
According to one pivot-point table: Weekly Standard pivot for HAL:
Pivot ~ ₹4,762.50
Support levels: ~ ₹4,604, ₹4,478
Resistance levels: ~ ₹4,888, ₹5,046
From a technical analysis site: Weekly S1 around ₹4,530, S2 around ₹4,433; R1 ~ ₹4,719, R2 ~ ₹4,811.
✅ For the Coming Week — What to Watch
Upside scenario: If HAL holds above ~ ₹4,760 (the weekly pivot area) and breaks above ~ ₹4,888-₹5,000, the next target zone could be ~ ₹5,000-₹5,100+ (within this week) given its proximity to recent 52-week highs.
Downside scenario: If it fails to hold the pivot ~ ₹4,760 and slides below ~ ₹4,600-₹4,500, then support zones ~ ₹4,478 and ~ ₹4,433 come into play. A break below those could open more downside.
Neutral / consolidation: It may also trade sideways between ~ ₹4,600 and ~ ₹4,900 until a catalyst drives a breakout.
I built a Buy & Sell Signal Indicator with 85% accuracy.
📈 Get access via DM or
WhatsApp: wa.link/d997q0
Contact - +91 76782 40962
| Email: techncialexpress@gmail.com
| Script Coder | Trader | Investor | From India
📈 Get access via DM or
WhatsApp: wa.link/d997q0
Contact - +91 76782 40962
| Email: techncialexpress@gmail.com
| Script Coder | Trader | Investor | From India
Publikasi terkait
Pernyataan Penyangkalan
Informasi dan publikasi ini tidak dimaksudkan, dan bukan merupakan, saran atau rekomendasi keuangan, investasi, trading, atau jenis lainnya yang diberikan atau didukung oleh TradingView. Baca selengkapnya di Ketentuan Penggunaan.