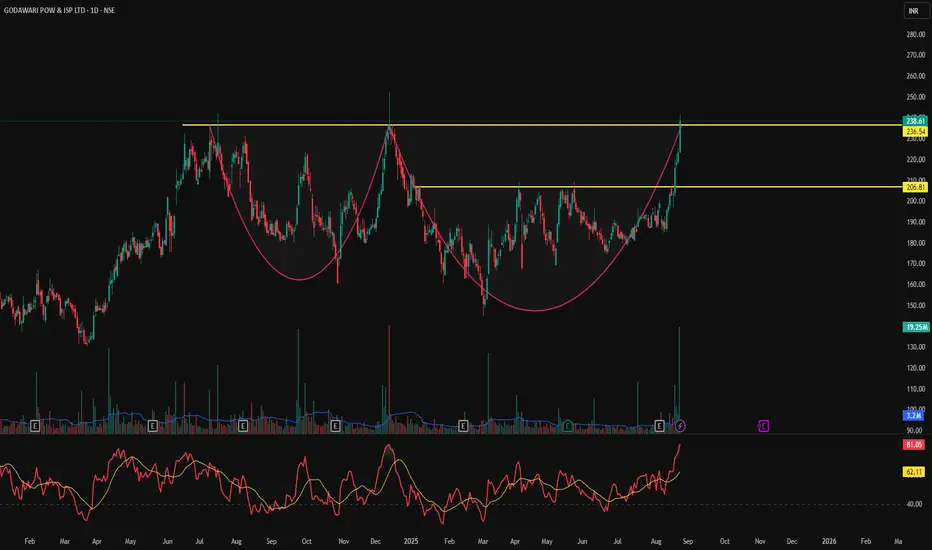
📊 GPIL – Cup & Handle Breakout with Explosive Volume | RSI > 80
📅 Chart Date: August 24, 2025
📍 CMP: ₹238.61 (+6.91%)
📈 Symbol: NSE:GPIL | 1D Timeframe
🔍 Technical Analysis
☕ Cup & Handle Breakout
A multi-month Cup & Handle pattern has been completed.
Price gave a strong breakout above the neckline zone ₹206.81.
Next supply zone is around ₹236–₹240, which is being tested.
💥 Volume Confirmation
Relative Volume (RVol): 842% 🔥
Today’s volume 19.25M vs avg 3.2M — heavy institutional buying.
📈 RSI (14, close): 81.05
Stock is in the overbought zone, indicating strong momentum.
Short-term pullback possible, but trend remains bullish above breakout.
📌 Key Levels
Breakout Zone (Support): ₹206.81
Immediate Resistance: ₹236–₹240
Next Target Levels: ₹260 / ₹280
Stoploss for Swing Traders: ₹200
Entry on Retest: ₹210–₹215
Stoploss: ₹200
Targets: ₹260 / ₹280
⚠️ Disclaimer: This is an educational chart setup and not trading advice. Please conduct your own research and risk management.
📣 Follow @PriceAction_Pulse for more such clean breakouts and chart pattern analysis!
🔁 Drop a comment if GPIL is on your radar for the next breakout rally 📈
Pernyataan Penyangkalan
Informasi dan publikasi tidak dimaksudkan untuk menjadi, dan bukan merupakan saran keuangan, investasi, perdagangan, atau rekomendasi lainnya yang diberikan atau didukung oleh TradingView. Baca selengkapnya di Persyaratan Penggunaan.
Pernyataan Penyangkalan
Informasi dan publikasi tidak dimaksudkan untuk menjadi, dan bukan merupakan saran keuangan, investasi, perdagangan, atau rekomendasi lainnya yang diberikan atau didukung oleh TradingView. Baca selengkapnya di Persyaratan Penggunaan.