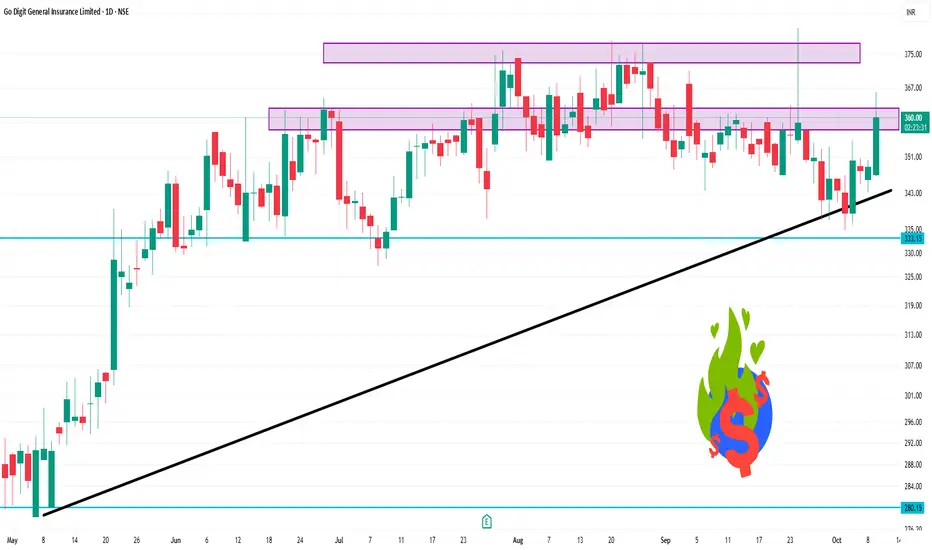
📊 Intraday Price Movement
Day’s Range: ₹346.65 – ₹350.15
Opening Price: ₹347.10
Closing Price (Previous Day): ₹348.80
Volume Traded: Approximately 55,201 shares
📈 Technical Indicators (1-Day Time Frame)
Relative Strength Index (RSI): 35.92 — indicates a neutral stance
Moving Averages:
5-Day EMA: ₹343.23 (Sell)
10-Day EMA: ₹346.88 (Sell)
20-Day EMA: ₹350.54 (Sell)
50-Day EMA: ₹351.97 (Sell)
100-Day EMA: ₹345.69 (Sell)
200-Day EMA: ₹334.59 (Buy)
MACD: -3.83 — suggests a potential buying opportunity
Commodity Channel Index (CCI): -206.91 — indicates a buying signal
Ultimate Oscillator: 28.51 — suggests a sell signal
Price Rate of Change (ROC): -5.88 — indicates a downward trend
🔍 Summary
The stock is exhibiting a neutral to slightly bearish trend in the short term, with several moving averages signaling a sell. However, indicators like MACD and CCI suggest potential buying opportunities. Investors should monitor for a sustained break above ₹350.00 for a more bullish outlook.
Publikasi terkait
Pernyataan Penyangkalan
Informasi dan publikasi ini tidak dimaksudkan, dan bukan merupakan, saran atau rekomendasi keuangan, investasi, trading, atau jenis lainnya yang diberikan atau didukung oleh TradingView. Baca selengkapnya di Ketentuan Penggunaan.
Publikasi terkait
Pernyataan Penyangkalan
Informasi dan publikasi ini tidak dimaksudkan, dan bukan merupakan, saran atau rekomendasi keuangan, investasi, trading, atau jenis lainnya yang diberikan atau didukung oleh TradingView. Baca selengkapnya di Ketentuan Penggunaan.