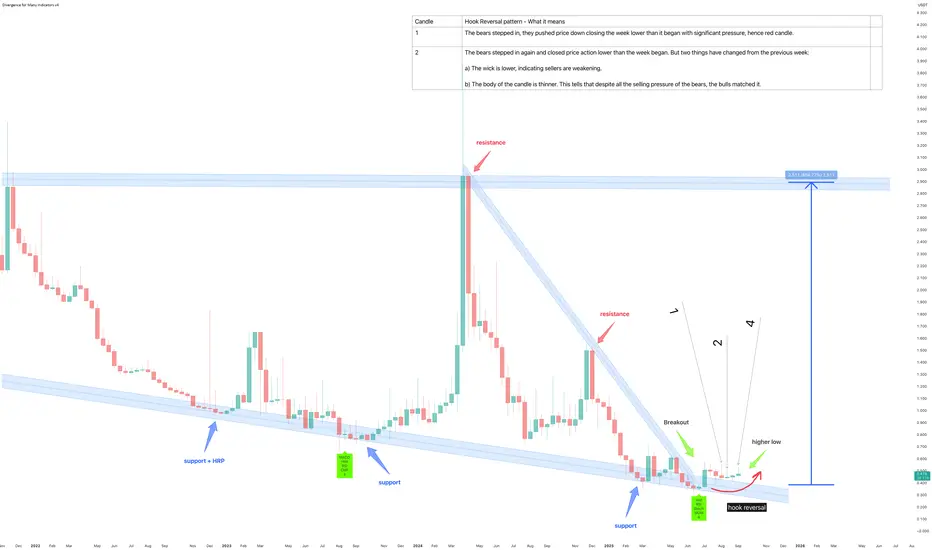
The above 11 day chart (don’t ask) tells us someone somewhere bought this token at $3.85 in March of 2024 before watching a 92% collapse in price action. The marketplace is now gripped by fear. Are sellers today correct, get out now before the remaining -8% to zero strikes? It certainly appears that way.
Support and resistance
The trend
Divergence
Hook reversal pattern
Conclusions
So, what have we learned? Basically, everyone panicked, sold their tokens like they were on fire and now we’re all sitting here pretending to be experts because a candle looks a bit different. *Ooooh, hook reversal pattern!* Yeah, alright mate, it’s a green line going up after a red one went down. Calm down.
The truth is: the bears are knackered, the bulls are sniffing around again, and if history repeats, we might actually see this thing shoot up. Or it won’t. That’s the game, innit? People want certainty but it’s crypto, it’s like betting on which one of your drunk uncles will fall down first at Christmas dinner. Odds are high, outcomes are unpredictable.
So yeah, maybe it’s a bottom. Maybe it’s the start of a big run. Or maybe we’ll all be here in two weeks going, “Remember when we thought that was bullish? Ha!” , either way, don’t bet your nan’s house on it.
Ww
Support and resistance
Price action has confirmed support on past resistances. Both legacy and the recent corrective resistance. This is also true of RSI.
The trend
For the first time in 21 months price action has printed a higher low.
Divergence
Price action prints positive divergence (USD and Bitcoin pairs) equivalent to that of August 2023 before an strong move printed.
Hook reversal pattern
A textbook hook reversal pattern has printed. You’ll find those patterns at market bottoms. The psychology of why they print is an interesting subject in its own right:
Candle by candle starting from ‘1st candle’
1) The bears stepped in, pushing price down closing the week lower than it began with significant pressure, hence red candle.
2) The bears stepped in again and closed price action lower than the week began, but two things have changed from the previous week:
a) The wick is lower, indicating sellers are weakening.
b) The body of the candle is thinner. This tells that despite all the selling pressure of the bears, the bulls matched it.
At this point you start to see something significant. A very thin body with a long wick above. This candle is called a ‘morning star’ and is confirmed with a ‘green candle’ in the following trading session, which we have. The psychology here is the bulls entered deep into the bears territory with not as much resistance as the previous session.
4) The first green candle. A ‘indecision candle’. The bears are confirmed ‘exhausted’, bulls closed price action higher than the previous trading session. The height of the wick is important here. Higher is stronger for future impulsive moves.
Finally we have arrive at the stage that attracts the most interest, the selling pressure is soaked up by the bulls, with future sell orders not only offered by those who bought at the pivot. This is why you often only see an “up only” move in price action afterwards.
Conclusions
So, what have we learned? Basically, everyone panicked, sold their tokens like they were on fire and now we’re all sitting here pretending to be experts because a candle looks a bit different. *Ooooh, hook reversal pattern!* Yeah, alright mate, it’s a green line going up after a red one went down. Calm down.
The truth is: the bears are knackered, the bulls are sniffing around again, and if history repeats, we might actually see this thing shoot up. Or it won’t. That’s the game, innit? People want certainty but it’s crypto, it’s like betting on which one of your drunk uncles will fall down first at Christmas dinner. Odds are high, outcomes are unpredictable.
So yeah, maybe it’s a bottom. Maybe it’s the start of a big run. Or maybe we’ll all be here in two weeks going, “Remember when we thought that was bullish? Ha!” , either way, don’t bet your nan’s house on it.
Ww
Trade aktif
Active on publication.Pernyataan Penyangkalan
Informasi dan publikasi tidak dimaksudkan untuk menjadi, dan bukan merupakan saran keuangan, investasi, perdagangan, atau rekomendasi lainnya yang diberikan atau didukung oleh TradingView. Baca selengkapnya di Persyaratan Penggunaan.
Pernyataan Penyangkalan
Informasi dan publikasi tidak dimaksudkan untuk menjadi, dan bukan merupakan saran keuangan, investasi, perdagangan, atau rekomendasi lainnya yang diberikan atau didukung oleh TradingView. Baca selengkapnya di Persyaratan Penggunaan.