Today we will take a look at the Daily chart on GBPCHF.
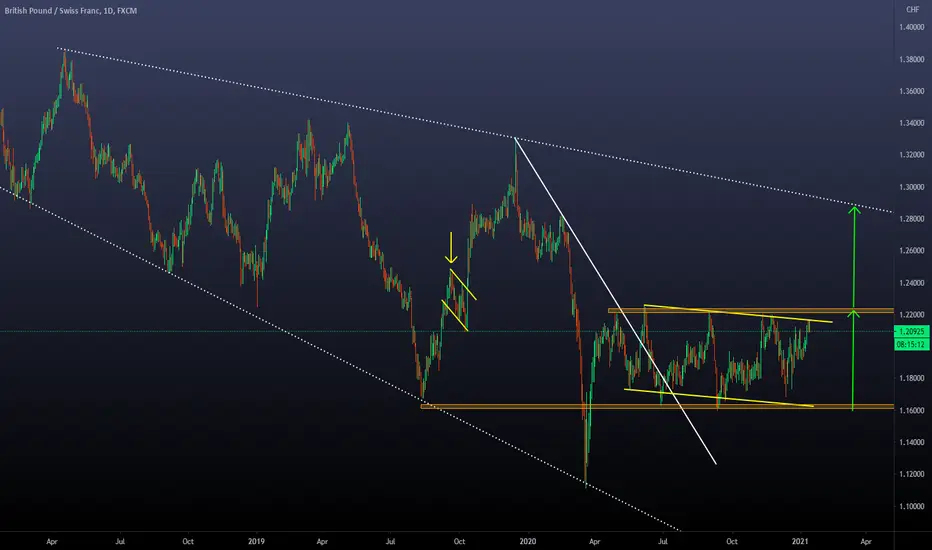
-The main structure we have is the expanding descending channel
-Inside the channel, we can see a range formed by the support zone at 1.16000 and the resistance zone at 1.22000
-Technical theory tells us that the expected movement after a breakout of a range is the extension of it. We can see that the extension provides a target that converges with the higher trendline of the descending channel
-If we have a breakout, we can expect to see a corrective structure with similar proportions to the one that happened before (yellow arrow) before the big bullish movement
-This is an interesting Forex Pair to keep an eye on due to the bullish potential it can provide if we have a breakout!
Pernyataan Penyangkalan
Informasi dan publikasi ini tidak dimaksudkan, dan bukan merupakan, saran atau rekomendasi keuangan, investasi, trading, atau jenis lainnya yang diberikan atau didukung oleh TradingView. Baca selengkapnya di Ketentuan Penggunaan.
Pernyataan Penyangkalan
Informasi dan publikasi ini tidak dimaksudkan, dan bukan merupakan, saran atau rekomendasi keuangan, investasi, trading, atau jenis lainnya yang diberikan atau didukung oleh TradingView. Baca selengkapnya di Ketentuan Penggunaan.