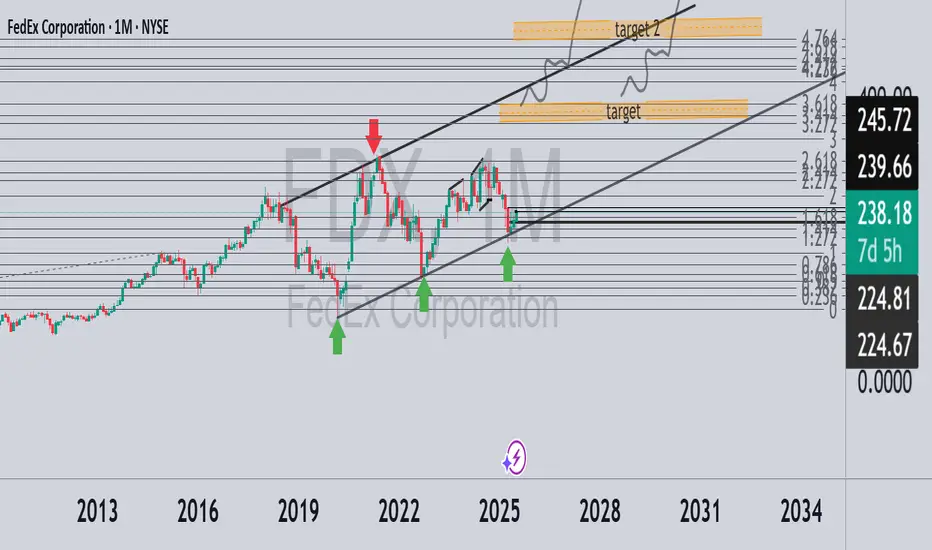
The monthly chart of FedEx (symbol: FDX) shows a classic ascending channel pattern, with the price touching the bottom of the channel several times and finding support (green arrows), and on the other hand stopping several times at the upper resistance line (red arrow).
In July, we received a strong monthly candle with a jump of almost 5%, right on the central support line - which indicates the beginning of a new upward move.
🎯 Two main targets in the medium term:
Target 1: Around the 3.618 Fibonacci levels - a significant resistance area from the past. If we manage to break through it, we will continue to...
Target 2: Level 4.764 - the wider target according to the channel pattern.
✅ A clear similarity to what happened with CRWD stock in the past: there too we received a decline to support with a green monthly candle - which led to a strong breakout later.
👀 Reddit also noticed this as early as July 18, exactly at the moment when the positive deviation from the lower channel began – the first hint of a change in trend.
Pernyataan Penyangkalan
Informasi dan publikasi tidak dimaksudkan untuk menjadi, dan bukan merupakan saran keuangan, investasi, perdagangan, atau rekomendasi lainnya yang diberikan atau didukung oleh TradingView. Baca selengkapnya di Persyaratan Penggunaan.
Pernyataan Penyangkalan
Informasi dan publikasi tidak dimaksudkan untuk menjadi, dan bukan merupakan saran keuangan, investasi, perdagangan, atau rekomendasi lainnya yang diberikan atau didukung oleh TradingView. Baca selengkapnya di Persyaratan Penggunaan.