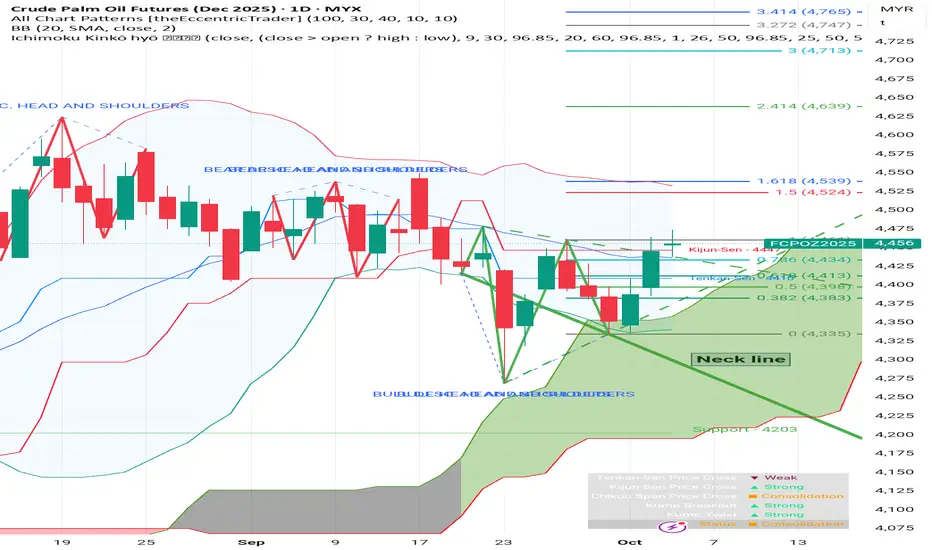
A descending trendline has been drawn, connecting the peaks between the shoulders and the head. A decisive break and close above this neckline would be a bullish confirmation signal, suggesting a potential trend reversal to the upside.
Ichimoku Cloud Analysis:
The price is currently trading inside the Kumo (the cloud), which typically indicates a state of consolidation or equilibrium.
A breakout above the top of the cloud (Senkou Span B) would add strength to the bullish case. Conversely, a fall below the bottom of the cloud (Senkou Span A) would be bearish.
The Kijun-Sen (blue line) at 4,441 is acting as a key level of support/resistance. The price is currently trading just above it.
An earlier Bearish Head and Shoulders pattern is marked on the chart from late August to mid-September. The price broke its neckline and subsequently trended downwards, which led to the formation of the current potential inverse pattern.
A Fibonacci retracement has been drawn from a recent swing high to the low of the "Head." The price is currently hovering near the 0.786 Fibonacci level (4,434).
The chart suggests that the Crude Palm Oil futures for December 2025 are in a consolidation phase after a prior downtrend. Traders are likely watching for the completion of the potential Inverse Head and Shoulders pattern. A breakout above the neckline and the Ichimoku Cloud would be a significant bullish signal. Until then, the price may continue to fluctuate between the key support and resistance levels.
Pernyataan Penyangkalan
Informasi dan publikasi tidak dimaksudkan untuk menjadi, dan bukan merupakan saran keuangan, investasi, perdagangan, atau rekomendasi lainnya yang diberikan atau didukung oleh TradingView. Baca selengkapnya di Persyaratan Penggunaan.
Pernyataan Penyangkalan
Informasi dan publikasi tidak dimaksudkan untuk menjadi, dan bukan merupakan saran keuangan, investasi, perdagangan, atau rekomendasi lainnya yang diberikan atau didukung oleh TradingView. Baca selengkapnya di Persyaratan Penggunaan.