Hi Traders
EUR/CAD Multi-Timeframe analysis (Update)
H1 CHART ( Bullish )
A medium probability, entry signal to go LONG was given at 1.53623 after the market found support at 1.53317 . Only the downward break of 1.53317 would cancel the bullish scenario.
Support & Resistances
1.53328 1.53548
1.53030 1.53735
1.52898 1.53975
H4 CHART ( Neutral )
Conflicting technical signals are indicating towards an unstable market, cautioning us to remain neutral and wait for a stronger trend to develop.
Support & Resistances
1.53124 1.53498
1.52619 1.53782
1.52092 1.54414
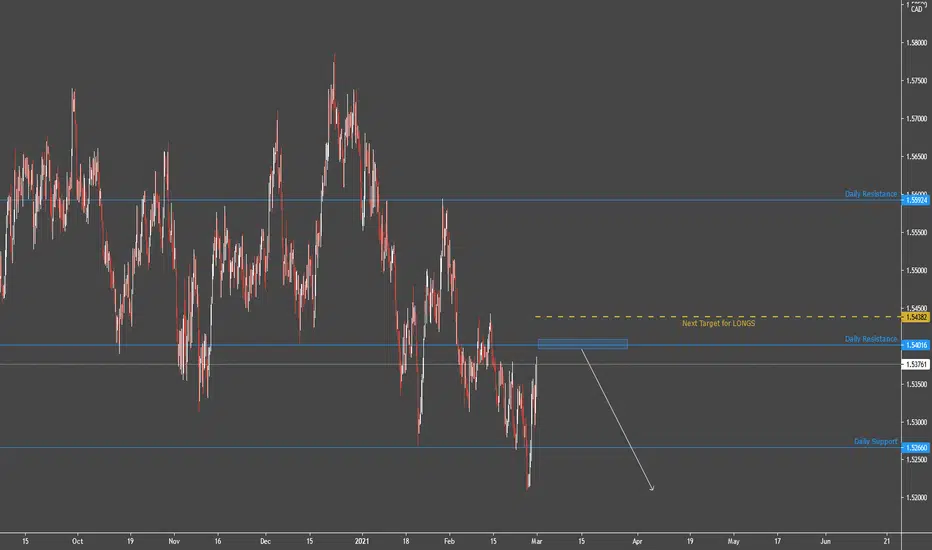
DAILY CHART ( Strong Down )
Waiting for a retracement higher towards the 1.52666 resistance level in order to reinstate SHORT positions. Next important resistance is the 1.54016 level.
Support & Resistances
1.52660 1.52666
1.50744 1.54016
1.47486 1.55924
WEEKLY CHART ( NEUTRAL )
The market is dominated by uncertainty. The occasionally prevailing trend lasts for a limited time and changes its direction too frequently. As long as the market remains unstable, we stay aside, waiting for the market to get back on track.
Support & Resistances
1.52666 1.59912
1.50518 1.62060
1.47707 1.64871
EUR/CAD Multi-Timeframe analysis (Update)
H1 CHART ( Bullish )
A medium probability, entry signal to go LONG was given at 1.53623 after the market found support at 1.53317 . Only the downward break of 1.53317 would cancel the bullish scenario.
Support & Resistances
1.53328 1.53548
1.53030 1.53735
1.52898 1.53975
H4 CHART ( Neutral )
Conflicting technical signals are indicating towards an unstable market, cautioning us to remain neutral and wait for a stronger trend to develop.
Support & Resistances
1.53124 1.53498
1.52619 1.53782
1.52092 1.54414
DAILY CHART ( Strong Down )
Waiting for a retracement higher towards the 1.52666 resistance level in order to reinstate SHORT positions. Next important resistance is the 1.54016 level.
Support & Resistances
1.52660 1.52666
1.50744 1.54016
1.47486 1.55924
WEEKLY CHART ( NEUTRAL )
The market is dominated by uncertainty. The occasionally prevailing trend lasts for a limited time and changes its direction too frequently. As long as the market remains unstable, we stay aside, waiting for the market to get back on track.
Support & Resistances
1.52666 1.59912
1.50518 1.62060
1.47707 1.64871
Get my tool FREE HERE:
bit.ly/2ODALGH
FREE TELEGRAM GROUP:
bit.ly/3rYHjyd
GET MY FREE EDUCATION HERE:
bit.ly/3pQudRX
bit.ly/2ODALGH
FREE TELEGRAM GROUP:
bit.ly/3rYHjyd
GET MY FREE EDUCATION HERE:
bit.ly/3pQudRX
Publikasi terkait
Pernyataan Penyangkalan
Informasi dan publikasi tidak dimaksudkan untuk menjadi, dan bukan merupakan saran keuangan, investasi, perdagangan, atau rekomendasi lainnya yang diberikan atau didukung oleh TradingView. Baca selengkapnya di Persyaratan Penggunaan.