Hi😊
Today we'll be analyzing the ETH USDT trading pair.
We'll start with the higher timeframe and move on to the lower one.
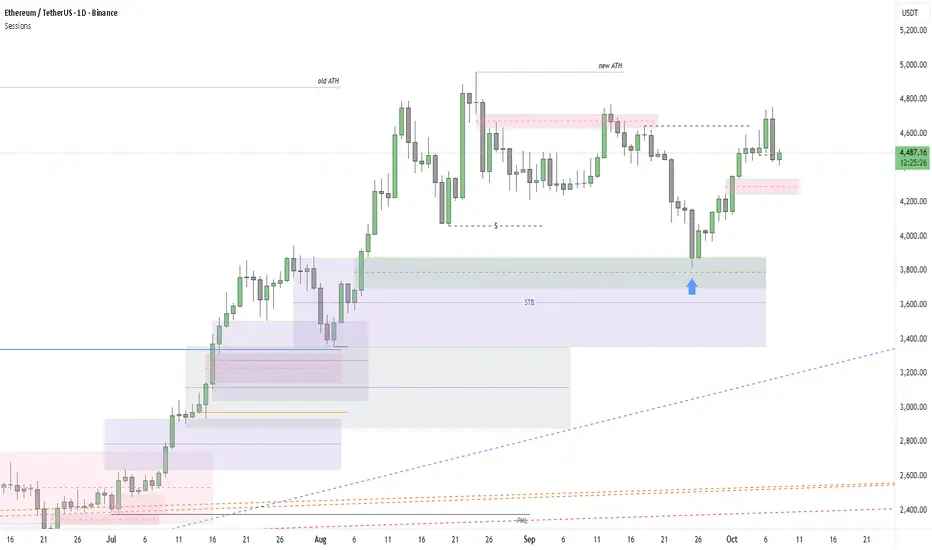
Let's start with the daily chart: after breaking the high, the price continued to trade sideways.
The IMB was tested from below, which responded and sent the price into a correction toward the downward wave.
After the local liquidity drain, the price showed bearish aggression.
Nearest support zone $4 332 - $4 245

1h timeframe: the price is showing a corrective movement, and has identified zones above from which a reaction to a further decline may occur

15m timeframe: there is a buildup of local liquidity for asset growth and price delivery to nearby problem areas

Leave your reactions and comments if you like these short reviews
Today we'll be analyzing the ETH USDT trading pair.
We'll start with the higher timeframe and move on to the lower one.
Let's start with the daily chart: after breaking the high, the price continued to trade sideways.
The IMB was tested from below, which responded and sent the price into a correction toward the downward wave.
After the local liquidity drain, the price showed bearish aggression.
Nearest support zone $4 332 - $4 245
1h timeframe: the price is showing a corrective movement, and has identified zones above from which a reaction to a further decline may occur
15m timeframe: there is a buildup of local liquidity for asset growth and price delivery to nearby problem areas
Leave your reactions and comments if you like these short reviews
Trading ditutup: target tercapai
the price reached the designated targetМой Телеграмм канал: t.me/mari_trade
Сообщество в ВК: vk.com/mari__trade
X: Mari_trading
Индикатор NewCopter | Copter 2.0: t.me/NewCopter
Сообщество в ВК: vk.com/mari__trade
X: Mari_trading
Индикатор NewCopter | Copter 2.0: t.me/NewCopter
Pernyataan Penyangkalan
Informasi dan publikasi tidak dimaksudkan untuk menjadi, dan bukan merupakan saran keuangan, investasi, perdagangan, atau rekomendasi lainnya yang diberikan atau didukung oleh TradingView. Baca selengkapnya di Persyaratan Penggunaan.
Мой Телеграмм канал: t.me/mari_trade
Сообщество в ВК: vk.com/mari__trade
X: Mari_trading
Индикатор NewCopter | Copter 2.0: t.me/NewCopter
Сообщество в ВК: vk.com/mari__trade
X: Mari_trading
Индикатор NewCopter | Copter 2.0: t.me/NewCopter
Pernyataan Penyangkalan
Informasi dan publikasi tidak dimaksudkan untuk menjadi, dan bukan merupakan saran keuangan, investasi, perdagangan, atau rekomendasi lainnya yang diberikan atau didukung oleh TradingView. Baca selengkapnya di Persyaratan Penggunaan.