Sure, here’s your analysis translated to English, keeping the SMC/ICT logic:
---
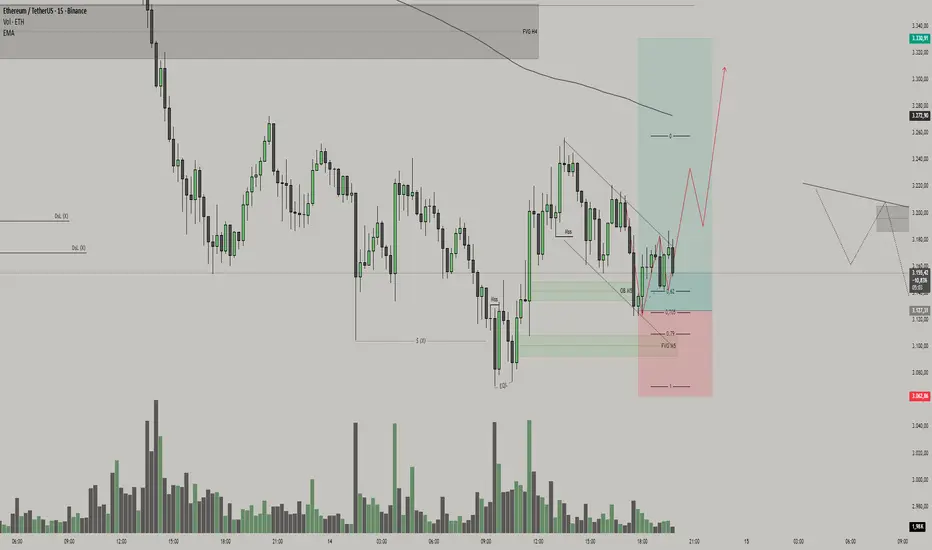
The chart shows ETH/USDT on the **M15**, inside a still bearish context, coming from a strong downside displacement that originated up in the **H4 FVG** (institutional supply zone). That leg down delivered price into **discount**, and after the first low (S QD), the market started to work inside a range, building liquidity on both sides.
On the right side of the chart we see the recent structure: price makes a new bearish impulse, **sweeps the previous low (Sweep of Dsl / sell-side liquidity)** and, right after that sweep, buying volume steps in and the market starts to react. This reaction creates a **bullish M5 order block** (marked in green) and an **M5 FVG** just below it, exactly where you drew the 0.62 / 0.705 / 0.79 retracements.
From an ICT perspective, this is classic:
* First, smart money reaches for liquidity below the lows (Sweep);
* Then it leaves an order block + imbalance in a discount area;
* After that, the expectation is **price expansion to the upside** toward an opposite liquidity/supply pool (in this case, the higher supply zone).
The descending dashed channel cutting through this reaction is the **“SSL” of the micro downtrend**. The break of this line together with a break of the last internal high gives us a **MSS/CHoCH to the upside** on intraday, suggesting that the efficient side *for now* is the buy side — not to fully reverse the macro trend, but to travel from “discount → premium”.
From this, the trade idea implied by the drawing is:
* **Buy zone (Demand/Entry):**
Pullback of price back into the **M5 OB + M5 FVG**, inside the 0.62–0.79 retracement block of the last bullish leg. That’s where we expect smart money to reload longs, defending the block after the Sweep.
* **Stop-loss (protection):**
Below the sweep low / bottom of the M5 FVG – around **3.06x** on the chart. If price accepts below that level, it means the OB failed and the long scenario is invalid.
* **Profit targets (take profit):**
1. **TP1:** return to the area of the last intraday highs (around **3.23x–3.25x**), where there’s buy-side liquidity to be taken.
2. **TP2 (main):** push into the **H4 FVG** around **3.33x**, which is the major higher-timeframe supply POI. In SMC logic: you’re aiming to capture the path of liquidity from the swept sell-side at the bottom up to the buy-side pool concentrated in that higher supply zone.
Once price reaches that **H4 FVG / institutional supply**, your own sketch already suggests the next SMC/ICT step: wait for distribution, a sweep of highs, and *then* look for a short scenario back down. In other words:
1. right now, the trade is a **long as a corrective move from discount**,
2. up there, you shift back to **shorts from the supply POI**.
All of this fits the SMC sequence: liquidity → displacement → OB/FVG mitigation → displacement in the opposite direction toward the next liquidity pool.
---
The chart shows ETH/USDT on the **M15**, inside a still bearish context, coming from a strong downside displacement that originated up in the **H4 FVG** (institutional supply zone). That leg down delivered price into **discount**, and after the first low (S QD), the market started to work inside a range, building liquidity on both sides.
On the right side of the chart we see the recent structure: price makes a new bearish impulse, **sweeps the previous low (Sweep of Dsl / sell-side liquidity)** and, right after that sweep, buying volume steps in and the market starts to react. This reaction creates a **bullish M5 order block** (marked in green) and an **M5 FVG** just below it, exactly where you drew the 0.62 / 0.705 / 0.79 retracements.
From an ICT perspective, this is classic:
* First, smart money reaches for liquidity below the lows (Sweep);
* Then it leaves an order block + imbalance in a discount area;
* After that, the expectation is **price expansion to the upside** toward an opposite liquidity/supply pool (in this case, the higher supply zone).
The descending dashed channel cutting through this reaction is the **“SSL” of the micro downtrend**. The break of this line together with a break of the last internal high gives us a **MSS/CHoCH to the upside** on intraday, suggesting that the efficient side *for now* is the buy side — not to fully reverse the macro trend, but to travel from “discount → premium”.
From this, the trade idea implied by the drawing is:
* **Buy zone (Demand/Entry):**
Pullback of price back into the **M5 OB + M5 FVG**, inside the 0.62–0.79 retracement block of the last bullish leg. That’s where we expect smart money to reload longs, defending the block after the Sweep.
* **Stop-loss (protection):**
Below the sweep low / bottom of the M5 FVG – around **3.06x** on the chart. If price accepts below that level, it means the OB failed and the long scenario is invalid.
* **Profit targets (take profit):**
1. **TP1:** return to the area of the last intraday highs (around **3.23x–3.25x**), where there’s buy-side liquidity to be taken.
2. **TP2 (main):** push into the **H4 FVG** around **3.33x**, which is the major higher-timeframe supply POI. In SMC logic: you’re aiming to capture the path of liquidity from the swept sell-side at the bottom up to the buy-side pool concentrated in that higher supply zone.
Once price reaches that **H4 FVG / institutional supply**, your own sketch already suggests the next SMC/ICT step: wait for distribution, a sweep of highs, and *then* look for a short scenario back down. In other words:
1. right now, the trade is a **long as a corrective move from discount**,
2. up there, you shift back to **shorts from the supply POI**.
All of this fits the SMC sequence: liquidity → displacement → OB/FVG mitigation → displacement in the opposite direction toward the next liquidity pool.
Pernyataan Penyangkalan
Informasi dan publikasi ini tidak dimaksudkan, dan bukan merupakan, saran atau rekomendasi keuangan, investasi, trading, atau jenis lainnya yang diberikan atau didukung oleh TradingView. Baca selengkapnya di Ketentuan Penggunaan.
Pernyataan Penyangkalan
Informasi dan publikasi ini tidak dimaksudkan, dan bukan merupakan, saran atau rekomendasi keuangan, investasi, trading, atau jenis lainnya yang diberikan atau didukung oleh TradingView. Baca selengkapnya di Ketentuan Penggunaan.