Key Takeaways
The trendlines of a triangle need to run along at least two swing highs and two swing lows.
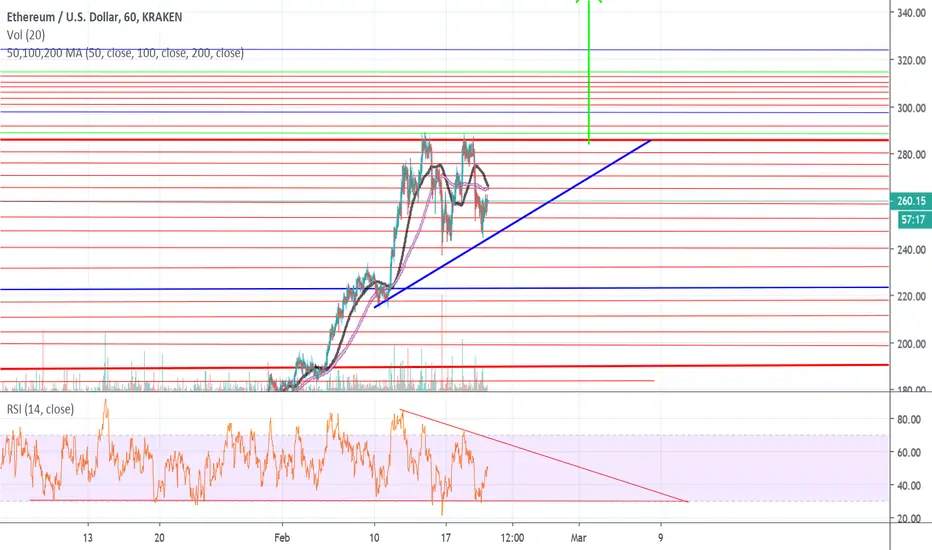
Ascending triangles are considered a continuation pattern, as the price will typically breakout of the triangle in the price direction prevailing before the triangle. Although, this won't always occur. A breakout in any direction is noteworthy.
A long trade is taken if the price breaks above the top of the pattern.
A short trade is taken if the price breaks below the lower trendline.
A stop loss is typically placed just outside the pattern on the opposite side from the breakout.
A profit target is calculated by taking the height of the triangle, at its thickest point, and adding or subtracting that to/from the breakout point.
The RSI is showing either a descending triangle or a bull flag, it could be a divergence & play out bearishly, only time will tell.
Bearish divergences signify potential downtrends when prices rally to a new high while the oscillator refuses to reach a new peak. In this situation, bulls are losing their grip on the market, prices are rising only as a result of inertia, and the bears are ready to take control again.
The trendlines of a triangle need to run along at least two swing highs and two swing lows.
Ascending triangles are considered a continuation pattern, as the price will typically breakout of the triangle in the price direction prevailing before the triangle. Although, this won't always occur. A breakout in any direction is noteworthy.
A long trade is taken if the price breaks above the top of the pattern.
A short trade is taken if the price breaks below the lower trendline.
A stop loss is typically placed just outside the pattern on the opposite side from the breakout.
A profit target is calculated by taking the height of the triangle, at its thickest point, and adding or subtracting that to/from the breakout point.
The RSI is showing either a descending triangle or a bull flag, it could be a divergence & play out bearishly, only time will tell.
Bearish divergences signify potential downtrends when prices rally to a new high while the oscillator refuses to reach a new peak. In this situation, bulls are losing their grip on the market, prices are rising only as a result of inertia, and the bears are ready to take control again.
Pernyataan Penyangkalan
Informasi dan publikasi tidak dimaksudkan untuk menjadi, dan bukan merupakan saran keuangan, investasi, perdagangan, atau rekomendasi lainnya yang diberikan atau didukung oleh TradingView. Baca selengkapnya di Persyaratan Penggunaan.
Pernyataan Penyangkalan
Informasi dan publikasi tidak dimaksudkan untuk menjadi, dan bukan merupakan saran keuangan, investasi, perdagangan, atau rekomendasi lainnya yang diberikan atau didukung oleh TradingView. Baca selengkapnya di Persyaratan Penggunaan.