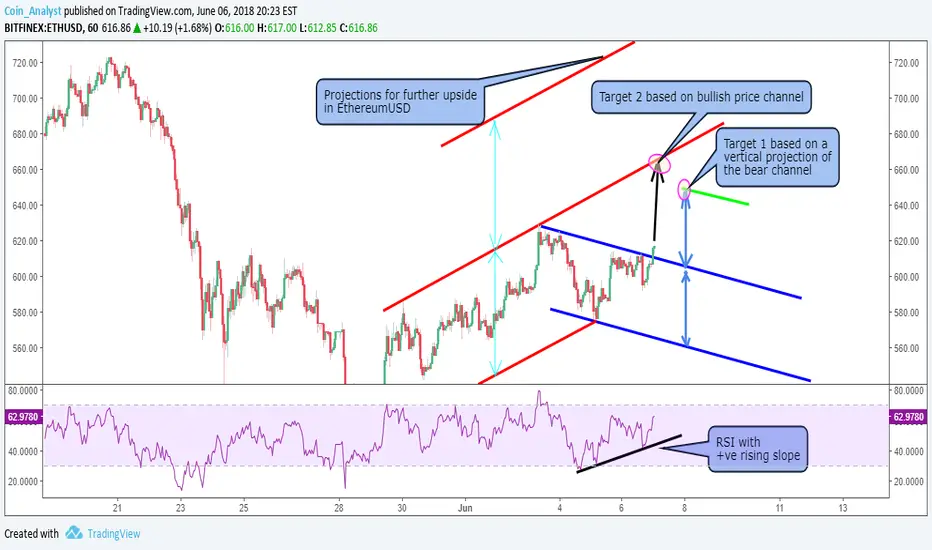
The 1hr tf chart of Ethereum (ETHUSD) as shown here captures the market action for Ethereum (ETHUSD) ever since price bottomed at ~ $511.64 on May 28, 2018.
The pink line is derived as a vertical projection of the top line (red) of the bullish channel. Further break to the upside past target 2 as shown on the chart could see Ethereum (ETHUSD) target the upper region of the pink line at ~$736.80.
Target 2 is based on price returning to the upper region of the current bullish channel and target 1 which is the most conservative is based on a vertical projection of the bear channel shown in blue.
RSI (relative strength index) as shown here has a positive rising slope and therefore implies further upside Momentum for Ethereum (ETHUSD)
Pernyataan Penyangkalan
Informasi dan publikasi ini tidak dimaksudkan, dan bukan merupakan, saran atau rekomendasi keuangan, investasi, trading, atau jenis lainnya yang diberikan atau didukung oleh TradingView. Baca selengkapnya di Ketentuan Penggunaan.
Pernyataan Penyangkalan
Informasi dan publikasi ini tidak dimaksudkan, dan bukan merupakan, saran atau rekomendasi keuangan, investasi, trading, atau jenis lainnya yang diberikan atau didukung oleh TradingView. Baca selengkapnya di Ketentuan Penggunaan.