Since the April lows, equity markets have exhibited strong performance, with many stocks appreciating by nearly 100%—some even exceeding that threshold. Given the velocity of this rally, a corrective pullback may be imminent before the broader uptrend resumes.
The current reading on the Fear & Greed Index places market sentiment firmly within the "extreme greed" territory—historically a zone where investors often begin to lock in profits or initiate contrarian positions against the prevailing trend.
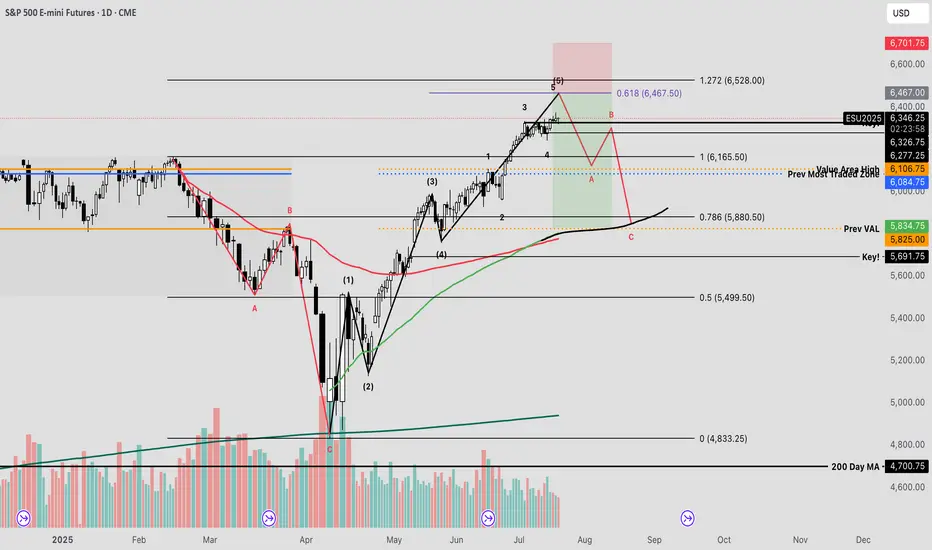
From a technical standpoint, I’ve conducted an Elliott Wave impulse analysis to evaluate the recent price structure. This method, which utilizes Fibonacci-based mathematical relationships, provides insight into the expansion and contraction phases of market cycles.
Using the trend-based Fibonacci extension tool, one can estimate potential termination zones for impulse waves. In the current scenario, the fifth wave appears to be approaching completion. By analyzing the proportional relationships between waves 1, 3, and 4, a key confluence level emerges at the 61.8% extension—commonly referred to as the “golden pocket”—just above the 6400 level on the futures chart.
I plan to set alerts at this price level to secure profits, hedge existing positions, and potentially initiate a short trade—should market structure confirm a reversal through a valid breakdown trigger.
The current reading on the Fear & Greed Index places market sentiment firmly within the "extreme greed" territory—historically a zone where investors often begin to lock in profits or initiate contrarian positions against the prevailing trend.
From a technical standpoint, I’ve conducted an Elliott Wave impulse analysis to evaluate the recent price structure. This method, which utilizes Fibonacci-based mathematical relationships, provides insight into the expansion and contraction phases of market cycles.
Using the trend-based Fibonacci extension tool, one can estimate potential termination zones for impulse waves. In the current scenario, the fifth wave appears to be approaching completion. By analyzing the proportional relationships between waves 1, 3, and 4, a key confluence level emerges at the 61.8% extension—commonly referred to as the “golden pocket”—just above the 6400 level on the futures chart.
I plan to set alerts at this price level to secure profits, hedge existing positions, and potentially initiate a short trade—should market structure confirm a reversal through a valid breakdown trigger.
Trade aktif
Taking the short on the bounce today into the ath range rejectionCatatan
Looking at the ES SP500 Futures, I am seeing a potential ABC structure, which is referred to be a corrective structure. otherwise can be referred to as a flag. Should price break above the current high, we would need to show decisive strength into the ath for higher price. For the current moment, I am worried if the market opens with a sharp move the the downside throughout the day. Catatan
The only interesting thing here for me is that although ES hit the target fib extension , the nq slightly front ran the level. But, it might be able to be accounted for as its within the parameters. I like how the nq holds the upper bounds of the previous high, which is much stronger than the ES where buyers could not quite hold the upper range on the drop. Catatan
Do the downside, we have some resistance here at the 786. Catatan
Compounding short position here on what I believe to be a liquidity grab trap Catatan
My second target is the wave 5 count on SPY, using trend based fib extensions to compare wave 1, 3 and 4Catatan
Compounding Short positionCatatan
Market gave another opportunity to compound shorts Catatan
Catatan
Im also aware that we may be forming the final 5th wave wedge according to elliot wave Pernyataan Penyangkalan
Informasi dan publikasi tidak dimaksudkan untuk menjadi, dan bukan merupakan saran keuangan, investasi, perdagangan, atau rekomendasi lainnya yang diberikan atau didukung oleh TradingView. Baca selengkapnya di Persyaratan Penggunaan.
Pernyataan Penyangkalan
Informasi dan publikasi tidak dimaksudkan untuk menjadi, dan bukan merupakan saran keuangan, investasi, perdagangan, atau rekomendasi lainnya yang diberikan atau didukung oleh TradingView. Baca selengkapnya di Persyaratan Penggunaan.