At 6am EST -yesterday's trade plan I wrote " My lean is that IF, we cannot break above 6420, we have a high probability of retesting yesterday's 6362 low." The high of the day was 6412.25 (10am on 15 min) and the low was bought up at 6370.25 (1:15pm on 15 min).
At 10:22am EST - I stated that "We could easily chop around between 6420-6385 for the rest of the day and into tomorrow" We did chop around in that general zone and we did until we lost 6385 and recovered in the afternoon.
Before I get into the overnight session and today's plan. Take a look at ES on a 4hr, 6hr, 8hr Chart and you will see the past 2 days institutional buying at the 6362-69. Massive wicks show support for this range. WHY is this important? It helps us understand what the big $$ are doing. This also will become in the future a potential major level that will continue to be bought up or will be an area we see a flush lower. Always zoom out and see big picture of what could be happening.
-----------------------------------------------------------------------------------------------
4:30am EST - August 22nd - Daily Trade Plan
Solely based on the "Big Picture" (8hr Chart) we are still in a bullish trend. We are not going to change trend until we lose 6245. You can also see a potential head and shoulders pattern building with 6468 being the left shoulder, 6508 being head and we can potentially expect 6468 being the area the right shoulder could build towards.
IF, you have been reading my daily trade plans, you will remember that I said on the "August 19, Big Picture View of Price" (See in related publication section to the right) "You can see that on July 31st we hit 6468.75 and price sold off nearly 225 points and buyers stepped back in on August 1st at 6245 and the cycle begins with selling at resistance and buying at supports of 6315, 6333, 6390, 6453-6456. WHY has price been very choppy in this 6456-6472 area? Price is either accumulating or distributing, but we never know until price loses a big support or resistance."
While I do not predict patterns or what price will do today, tomorrow or next week. I just look for clues and then plan what levels I want to see flush and recover to follow the institutions.
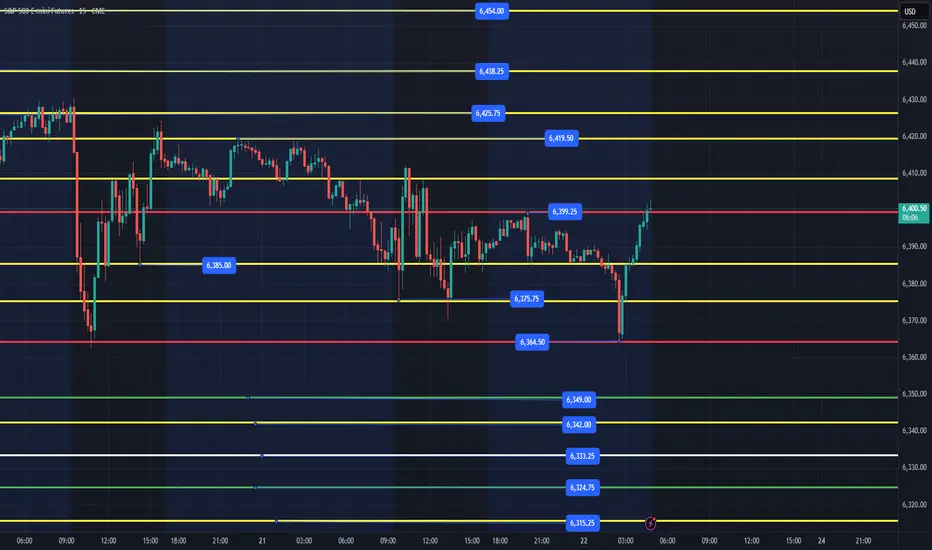
Let's talk about today's plan and discuss what areas we want to see opportunities to grab some points. We have had a high of 6399.25 and 6364.50 as our high and low of the overnight session. Price still needs to clear 6420 to continue up the levels in yellow with 6468 eventually being initial target area for the next potential sell off. Price will go back and forth and chop up retail investors until the institutions have distributed enough to let price just flush down to a level they want to step back in and the cycle repeats. I missed the overnight flush of yesterday afternoon 6370 low (2:30am) and now price is coming into the overnight session resistance of 6399.25.
I need to identify either a move to retest 6412, back test 6399 and then buy on the support for a move to test 6420. Ideally, we could sell off back to the 6364 level or even better 6350, scare retail investors and then wait for a reclaim of 6364 to get back in and ride up. There is a Fed Meeting in Jackson Hole, and I expect some volatility after the NYSE open. I will be patient and wait until after the open to determine what price is doing and where there are good opportunities to enter either by a flush and reclaim of a level or a move higher and back test.
Be patient today, it could get volatile and it's better to wait for good setups to enter. My ideal scenario is waiting for one more good flush of 6364 and reclaim with a rally into the weekend and setting up for an end of month week into Labor Day holiday!
At 10:22am EST - I stated that "We could easily chop around between 6420-6385 for the rest of the day and into tomorrow" We did chop around in that general zone and we did until we lost 6385 and recovered in the afternoon.
Before I get into the overnight session and today's plan. Take a look at ES on a 4hr, 6hr, 8hr Chart and you will see the past 2 days institutional buying at the 6362-69. Massive wicks show support for this range. WHY is this important? It helps us understand what the big $$ are doing. This also will become in the future a potential major level that will continue to be bought up or will be an area we see a flush lower. Always zoom out and see big picture of what could be happening.
-----------------------------------------------------------------------------------------------
4:30am EST - August 22nd - Daily Trade Plan
Solely based on the "Big Picture" (8hr Chart) we are still in a bullish trend. We are not going to change trend until we lose 6245. You can also see a potential head and shoulders pattern building with 6468 being the left shoulder, 6508 being head and we can potentially expect 6468 being the area the right shoulder could build towards.
IF, you have been reading my daily trade plans, you will remember that I said on the "August 19, Big Picture View of Price" (See in related publication section to the right) "You can see that on July 31st we hit 6468.75 and price sold off nearly 225 points and buyers stepped back in on August 1st at 6245 and the cycle begins with selling at resistance and buying at supports of 6315, 6333, 6390, 6453-6456. WHY has price been very choppy in this 6456-6472 area? Price is either accumulating or distributing, but we never know until price loses a big support or resistance."
While I do not predict patterns or what price will do today, tomorrow or next week. I just look for clues and then plan what levels I want to see flush and recover to follow the institutions.
Let's talk about today's plan and discuss what areas we want to see opportunities to grab some points. We have had a high of 6399.25 and 6364.50 as our high and low of the overnight session. Price still needs to clear 6420 to continue up the levels in yellow with 6468 eventually being initial target area for the next potential sell off. Price will go back and forth and chop up retail investors until the institutions have distributed enough to let price just flush down to a level they want to step back in and the cycle repeats. I missed the overnight flush of yesterday afternoon 6370 low (2:30am) and now price is coming into the overnight session resistance of 6399.25.
I need to identify either a move to retest 6412, back test 6399 and then buy on the support for a move to test 6420. Ideally, we could sell off back to the 6364 level or even better 6350, scare retail investors and then wait for a reclaim of 6364 to get back in and ride up. There is a Fed Meeting in Jackson Hole, and I expect some volatility after the NYSE open. I will be patient and wait until after the open to determine what price is doing and where there are good opportunities to enter either by a flush and reclaim of a level or a move higher and back test.
Be patient today, it could get volatile and it's better to wait for good setups to enter. My ideal scenario is waiting for one more good flush of 6364 and reclaim with a rally into the weekend and setting up for an end of month week into Labor Day holiday!
Publikasi terkait
Pernyataan Penyangkalan
The information and publications are not meant to be, and do not constitute, financial, investment, trading, or other types of advice or recommendations supplied or endorsed by TradingView. Read more in the Terms of Use.
Publikasi terkait
Pernyataan Penyangkalan
The information and publications are not meant to be, and do not constitute, financial, investment, trading, or other types of advice or recommendations supplied or endorsed by TradingView. Read more in the Terms of Use.