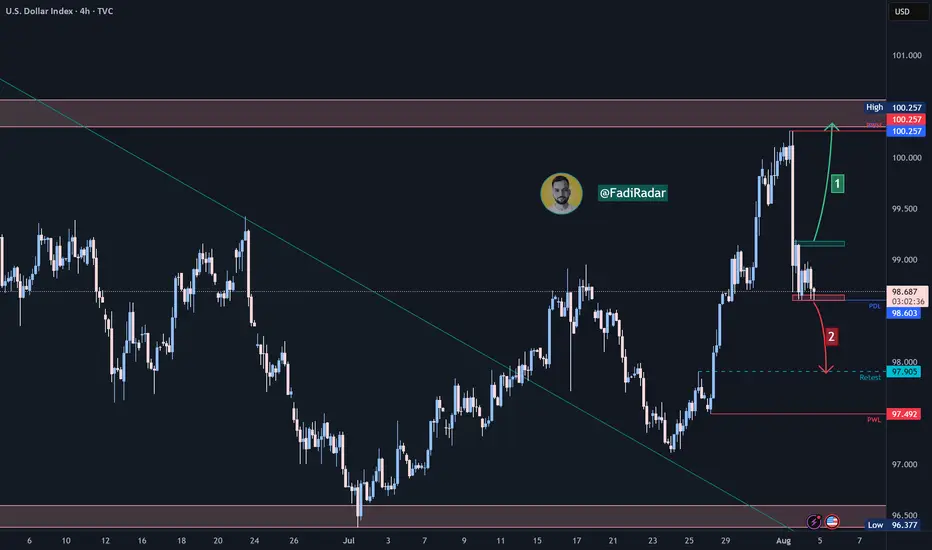
The DXY is currently moving sideways near the 98.65 support zone after a sharp drop from the 100.25 resistance, which marked last week’s high.
🔹 Bearish Scenario:
If the price breaks below 98.65 and holds, a continuation toward 97.90 is likely, with potential to reach the 97.50 support area.
🔹 Bullish Scenario:
If the price reclaims 99.00 and confirms support above it, we could see a retest of the 99.50–100.25 resistance zone, which remains key in the short term.
⚠️ Disclaimer:
This analysis is not financial advice. It is recommended to monitor the markets and carefully analyze the data before making any investment decisions.
Pernyataan Penyangkalan
The information and publications are not meant to be, and do not constitute, financial, investment, trading, or other types of advice or recommendations supplied or endorsed by TradingView. Read more in the Terms of Use.
Pernyataan Penyangkalan
The information and publications are not meant to be, and do not constitute, financial, investment, trading, or other types of advice or recommendations supplied or endorsed by TradingView. Read more in the Terms of Use.