📌 Recent Price & Context
Last price around ₹ 14,554–₹ 14,570.
52‑week range: low ~ ₹12,202 and high ~ ₹19,149.
Recent technicals (RSI, MACD, etc.) suggest weak momentum / a “sell” bias on daily chart.
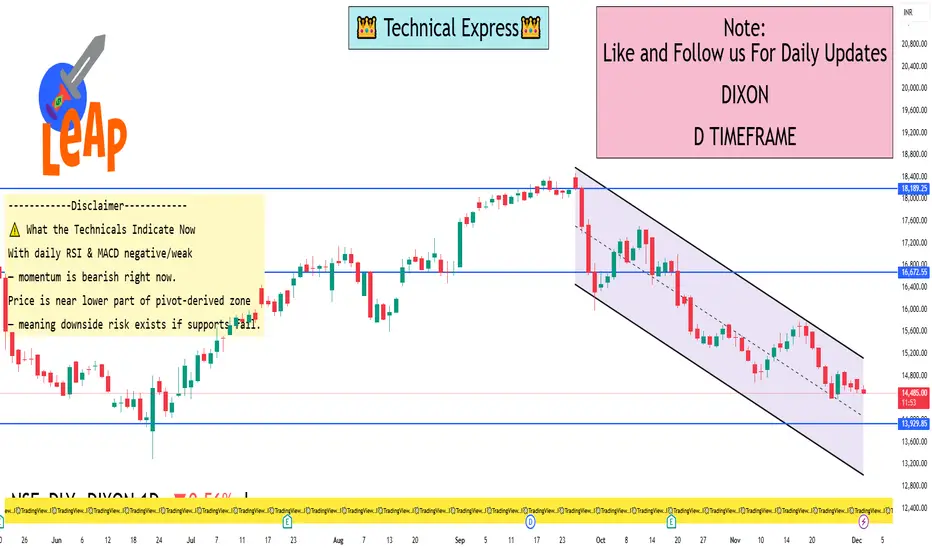
⚠️ What the Technicals Indicate Now
With daily RSI & MACD negative/weak — momentum is bearish right now.
Price is near lower part of pivot‑derived zone — meaning downside risk exists if supports fail.
For bulls to regain control, breaking above ~ ₹14,400–14,500 (R1–R2) would be an encouraging sign — could pave way to medium‑term levels.
If support at ~ ₹14,115–14,020 breaks, the next major support would be around the lower zone / 52‑week low vicinity (but that’s a bigger move).
Last price around ₹ 14,554–₹ 14,570.
52‑week range: low ~ ₹12,202 and high ~ ₹19,149.
Recent technicals (RSI, MACD, etc.) suggest weak momentum / a “sell” bias on daily chart.
⚠️ What the Technicals Indicate Now
With daily RSI & MACD negative/weak — momentum is bearish right now.
Price is near lower part of pivot‑derived zone — meaning downside risk exists if supports fail.
For bulls to regain control, breaking above ~ ₹14,400–14,500 (R1–R2) would be an encouraging sign — could pave way to medium‑term levels.
If support at ~ ₹14,115–14,020 breaks, the next major support would be around the lower zone / 52‑week low vicinity (but that’s a bigger move).
I built a Buy & Sell Signal Indicator with 85% accuracy.
📈 Get access via DM or
WhatsApp: wa.link/d997q0
Contact - +91 76782 40962
| Email: techncialexpress@gmail.com
| Script Coder | Trader | Investor | From India
📈 Get access via DM or
WhatsApp: wa.link/d997q0
Contact - +91 76782 40962
| Email: techncialexpress@gmail.com
| Script Coder | Trader | Investor | From India
Publikasi terkait
Pernyataan Penyangkalan
Informasi dan publikasi ini tidak dimaksudkan, dan bukan merupakan, saran atau rekomendasi keuangan, investasi, trading, atau jenis lainnya yang diberikan atau didukung oleh TradingView. Baca selengkapnya di Ketentuan Penggunaan.