📈 1-Month Performance Snapshot (September 9 – October 9, 2025)
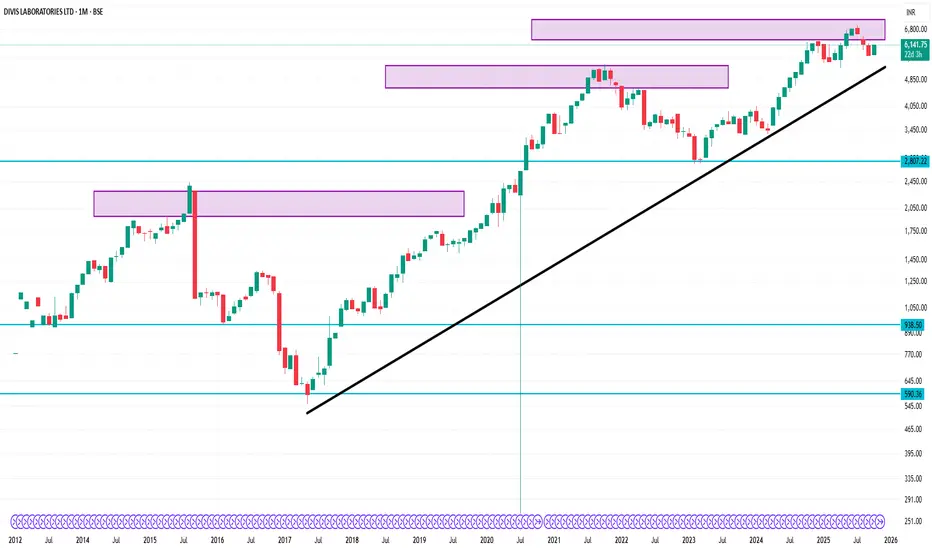
Opening Price (Sep 9, 2025): ₹6,025.00
Closing Price (Oct 9, 2025): ₹6,149.00
Price Change: +₹124.00 (+2.06%)
52-Week Range: ₹4,955.00 – ₹7,071.50
Current Price vs. 52-Week High: -12.98%
Current Price vs. 52-Week Low: +24.14%
Trading Volume (Oct 9): Approximately 129,890 shares
5-Day Moving Average: ₹6,128.00
20-Day Exponential Moving Average (EMA): ₹6,110.08
1-Month Return: +1.54%
📊 Recent Performance Highlights
October 8, 2025: Closed at ₹6,120.50 (+0.26%)
October 7, 2025: Closed at ₹6,104.50 (+4.77%)
October 6, 2025: Closed at ₹5,826.50 (-0.67%)
October 3, 2025: Closed at ₹5,866.00 (+2.73%)
October 1, 2025: Closed at ₹5,710.00 (+0.36%)
🧾 Key Financial Metrics
P/E Ratio (TTM): 70.29
EPS (TTM): ₹86.80
Market Capitalization: ₹1.62 trillion
Dividend Yield: 0.49%
Debt-to-Equity Ratio: 0.00 (indicating a debt-free status)
Publikasi terkait
Pernyataan Penyangkalan
Informasi dan publikasi ini tidak dimaksudkan, dan bukan merupakan, saran atau rekomendasi keuangan, investasi, trading, atau jenis lainnya yang diberikan atau didukung oleh TradingView. Baca selengkapnya di Ketentuan Penggunaan.
Publikasi terkait
Pernyataan Penyangkalan
Informasi dan publikasi ini tidak dimaksudkan, dan bukan merupakan, saran atau rekomendasi keuangan, investasi, trading, atau jenis lainnya yang diberikan atau didukung oleh TradingView. Baca selengkapnya di Ketentuan Penggunaan.