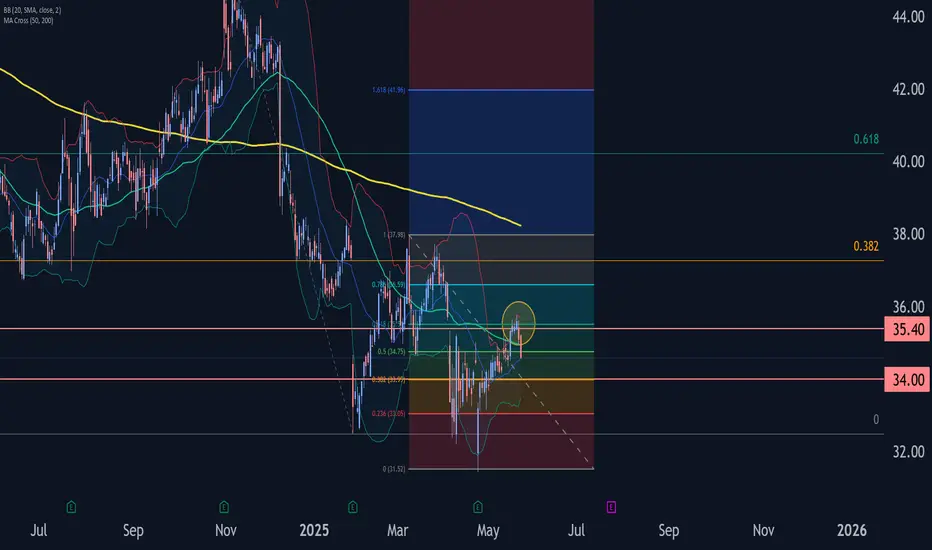
- Comcast reversed from resistance area
- Likely to fall to support level 34.00
Comcast recently reversed down from the resistance area between the resistance level 35.40, upper daily Bollinger Band and the 61.8% Fibonacci correction of the downward impulse from November.
The downward reversal from the resistance zone started the active impulse wave 3, which today broke the daily up channel from April.
Given the clear daily downtrend, Comcast can be expected to fall to the next support level 34.00 (low of the previous minor correction (b)).
Alexander Kuptsikevich,
Chief Market Analyst at FxPro
----------
Follow our Telegram channel t.me/fxpro dedicated to providing insightful market analysis and expertise.
Reach out to media.comments@fxpro.com for PR and media inquiries
Chief Market Analyst at FxPro
----------
Follow our Telegram channel t.me/fxpro dedicated to providing insightful market analysis and expertise.
Reach out to media.comments@fxpro.com for PR and media inquiries
Pernyataan Penyangkalan
Informasi dan publikasi tidak dimaksudkan untuk menjadi, dan bukan merupakan saran keuangan, investasi, perdagangan, atau rekomendasi lainnya yang diberikan atau didukung oleh TradingView. Baca selengkapnya di Persyaratan Penggunaan.