**Ceinsys Tech Ltd. (CEINSYS) | BSE**
**1. Fundamentals Snapshot**
* **Quarterly growth:** Q1 FY 2025–26 delivered ₹157 Cr in sales (+112% YoY), EBITDA of ₹30.3 Cr (+129%), and net profit ₹31.6 Cr (+166%). EPS came in at ₹18.14 vs ₹7.29 last year ([Moneycontrol][1], [Trendlyne.com][2]).
* **Valuation:** Trades at \~47× trailing P/E (median \~47–49), PB \~7×, Price/Sales \~5.7×–7× ([The Economic Times][3], [Reuters][4]). High growth priced into a small-cap (\~₹3,100 Cr) ([Reuters][4], [The Economic Times][3]).
* **Debt & Structure:** Low leverage (total debt/equity under 1.2), efficient operation, but long debtor cycle (\~221 days) may impact working capital ([screener.in][5]).
**2. Technical Setup & Chart Analysis**
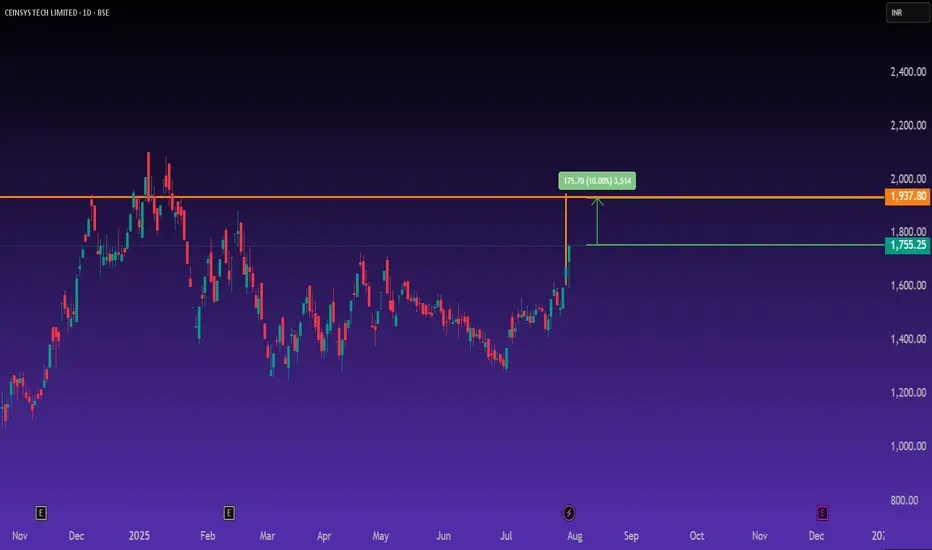
* **Trend:** The stock recently broke out strongly from a multi-month consolidation base around ₹1,400–1,500. At \~₹1,755, it has gained \~10% in recent session and volume spiked significantly ([investing.com][6]).
* **Momentum:** Technical ratings from TradingView classify it as Strong Buy across daily, weekly and monthly frames ﹘ a clear bullish bias driven by moving averages, MACD, RSI and Ichimoku alignments ([tradingview.com][7], [tradingview.com][8]).
* **Support/Resistance:** MarketScreener flags near-term support at ₹1,444, mid‑term support around ₹1,287; immediate resistance lies near ₹1,807 and then ₹2,011 (long-term) ([MarketScreener][9]).
* **Chart Tone:** The daily chart shows a series of higher highs and higher lows, marking a classical breakout—ideal for momentum traders with tight stops just below breakout origin (\~₹1,700).
**3. Risk‑Reward Outlook**
* **Upside potential:** Room to run to ₹1,937–2,000 if momentum sustains. That’s \~10–15% from current levels.
* **Risks:** High valuation leaves little margin for error; any slowdown in growth, expanding working capital, or adverse sentiment could lead to sharp pullbacks. Earnings surprises or delays may shake momentum.
**4. Trading Execution Plan**
* **Entry range:** ₹1,740–1,780 (on strength or retest of breakout zone).
* **Stop‑loss:** ₹1,685–1,700, just below prior congestion zone.
* **Target zones:** Take profits near ₹1,937–2,000, trail partial positions to capture extended move.
---
## 🖼️ Chart Interpretation
The chart clearly shows a bullish extension off a sideways base. The green line marks the breakout price (\~₹1,755), and the orange line above signals the next resistance zone near ₹1,937. Volume spiked markedly at breakout, highlighting institutional accumulation. The overall structure supports continuation toward ₹2,000, while recent consolidative levels form logical stop-loss zones.
---
**Summary:** Ceinsys Tech’s stellar Q1 earnings and breakout technical setup align well for momentum-based long strategies. With earnings momentum, improving margin, and strong price action, there’s a low‑risk entry for a measured upside. Valuation is rich but growth trajectory underpins it—for traders aligned to momentum, this remains a clear opportunity with tight risk control.
This analysis is for educational and informational purposes only. It is not investment advice or a recommendation to buy, sell, or hold any securities. Please do your own research (DYOR) and consult a SEBI‑registered financial advisor before making any investment or trading decisions. I am not SEBI registered.
Pernyataan Penyangkalan
The information and publications are not meant to be, and do not constitute, financial, investment, trading, or other types of advice or recommendations supplied or endorsed by TradingView. Read more in the Terms of Use.
Pernyataan Penyangkalan
The information and publications are not meant to be, and do not constitute, financial, investment, trading, or other types of advice or recommendations supplied or endorsed by TradingView. Read more in the Terms of Use.