Cocoa Seasonal Confluence Zone – Q4 Outlook
This is a multi-confluence analysis of cocoa futures, combining seasonal patterns, structural levels and institutional positioning zones.
All key levels and insights are annotated directly on the charts for clarity and quick visual reference.
Seasonality & Timing:
Cocoa is historically a seasonal asset, with long-term buy opportunities often emerging between October and December.
With only a limited window before the next quarterly cycle, there is a high probability of accumulation developing this month or next.
Data Integrity Note:
The ICEUS feed provides the most authoritative and historically complete data for cocoa futures, with records extending back to 1980.
This deep data history ensures that the monthly EMAs, pivot levels, and seasonal statistics are calculated on a continuous, reliable series.
To illustrate the impact of data history, this post includes three charts:
• ICEUS (main reference) – full historical feed since 1980, used for all structural levels (EMA-50, pivots, seasonal stats).

• Pepperstone – history begins in 2015; shorter look-back affects EMA-50 and pivot alignment but offers a good execution-side view.

• FP Markets – history begins in 2022; good for broker-specific volume but not reliable for long-term structural calculations.

This comparison also highlights how truncated feeds can distort long-term indicators.
For accuracy in technical structure, ICEUS is treated as the benchmark, while Pepperstone and FP Markets are included for context and liquidity considerations and also show how the levels are aligning.
Key Confluence Zone (ICEUS):
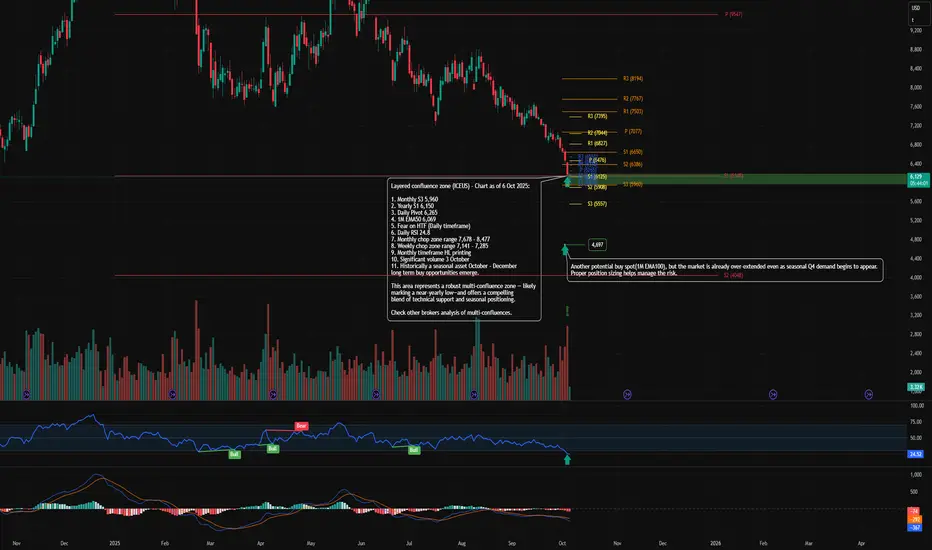
Price has recently tapped 1M EMA-50 at 6,069, aligned with yearly S1 at 6,150, daily S3 at 6,089, and is approaching monthly S3 near 5,960.
This cluster forms a robust multi-confluence zone — likely near a yearly low — offering a compelling blend of technical support and seasonal positioning.
Institutional Positioning Outlook:
Cocoa typically attracts institutional accumulation in Q4 driven by seasonal demand and hedging flows ahead of the holiday chocolate season.
The layered support region around 5,950 – 6,250 coincides with historical areas where managed-money net-long positions tend to build.
This confluence of technical structure, seasonal demand, and historical positioning patterns suggests that larger participants may start scaling in over the coming quarter.
Trade Consideration:
Given the time-sensitive seasonal setup and layered technical structure, cocoa currently presents a high-probability observation zone with an attractive risk-to-reward profile.
This is not a buy or sell signal. It highlights a high-probability zone where multiple confluences align, useful for observation and study.
⚠️ Risk Note:
It is recommended not to overleverage your positions. Overexposure is the main killer of portfolios. Position sizing directly impacts mental clarity: excessive size can cloud judgment and trigger emotional reactions, while appropriate sizing supports composure and disciplined execution. It is better to collect steady breadcrumbs than to risk giving away your capital. Trading risk can be managed but never eliminated.
❗️Disclaimer:
This content is provided for educational purposes only. It does not constitute financial, legal, tax, or investment advice. The author does not provide trading signals, portfolio management, or any services regulated by the Financial Conduct Authority.
Note: The full analysis was conducted using the author’s private custom indicators.
In accordance with TradingView’s publishing rules, those indicators are not displayed on these charts. All key levels and conclusions derived from them have been manually highlighted for educational purposes.
This is a multi-confluence analysis of cocoa futures, combining seasonal patterns, structural levels and institutional positioning zones.
All key levels and insights are annotated directly on the charts for clarity and quick visual reference.
Seasonality & Timing:
Cocoa is historically a seasonal asset, with long-term buy opportunities often emerging between October and December.
With only a limited window before the next quarterly cycle, there is a high probability of accumulation developing this month or next.
Data Integrity Note:
The ICEUS feed provides the most authoritative and historically complete data for cocoa futures, with records extending back to 1980.
This deep data history ensures that the monthly EMAs, pivot levels, and seasonal statistics are calculated on a continuous, reliable series.
To illustrate the impact of data history, this post includes three charts:
• ICEUS (main reference) – full historical feed since 1980, used for all structural levels (EMA-50, pivots, seasonal stats).
• Pepperstone – history begins in 2015; shorter look-back affects EMA-50 and pivot alignment but offers a good execution-side view.
• FP Markets – history begins in 2022; good for broker-specific volume but not reliable for long-term structural calculations.
This comparison also highlights how truncated feeds can distort long-term indicators.
For accuracy in technical structure, ICEUS is treated as the benchmark, while Pepperstone and FP Markets are included for context and liquidity considerations and also show how the levels are aligning.
Key Confluence Zone (ICEUS):
Price has recently tapped 1M EMA-50 at 6,069, aligned with yearly S1 at 6,150, daily S3 at 6,089, and is approaching monthly S3 near 5,960.
This cluster forms a robust multi-confluence zone — likely near a yearly low — offering a compelling blend of technical support and seasonal positioning.
Institutional Positioning Outlook:
Cocoa typically attracts institutional accumulation in Q4 driven by seasonal demand and hedging flows ahead of the holiday chocolate season.
The layered support region around 5,950 – 6,250 coincides with historical areas where managed-money net-long positions tend to build.
This confluence of technical structure, seasonal demand, and historical positioning patterns suggests that larger participants may start scaling in over the coming quarter.
Trade Consideration:
Given the time-sensitive seasonal setup and layered technical structure, cocoa currently presents a high-probability observation zone with an attractive risk-to-reward profile.
This is not a buy or sell signal. It highlights a high-probability zone where multiple confluences align, useful for observation and study.
⚠️ Risk Note:
It is recommended not to overleverage your positions. Overexposure is the main killer of portfolios. Position sizing directly impacts mental clarity: excessive size can cloud judgment and trigger emotional reactions, while appropriate sizing supports composure and disciplined execution. It is better to collect steady breadcrumbs than to risk giving away your capital. Trading risk can be managed but never eliminated.
❗️Disclaimer:
This content is provided for educational purposes only. It does not constitute financial, legal, tax, or investment advice. The author does not provide trading signals, portfolio management, or any services regulated by the Financial Conduct Authority.
Note: The full analysis was conducted using the author’s private custom indicators.
In accordance with TradingView’s publishing rules, those indicators are not displayed on these charts. All key levels and conclusions derived from them have been manually highlighted for educational purposes.
Pernyataan Penyangkalan
Informasi dan publikasi tidak dimaksudkan untuk menjadi, dan bukan merupakan saran keuangan, investasi, perdagangan, atau rekomendasi lainnya yang diberikan atau didukung oleh TradingView. Baca selengkapnya di Persyaratan Penggunaan.
Pernyataan Penyangkalan
Informasi dan publikasi tidak dimaksudkan untuk menjadi, dan bukan merupakan saran keuangan, investasi, perdagangan, atau rekomendasi lainnya yang diberikan atau didukung oleh TradingView. Baca selengkapnya di Persyaratan Penggunaan.