Triangle Pattern Strategy for Breakout within Range | Study Only
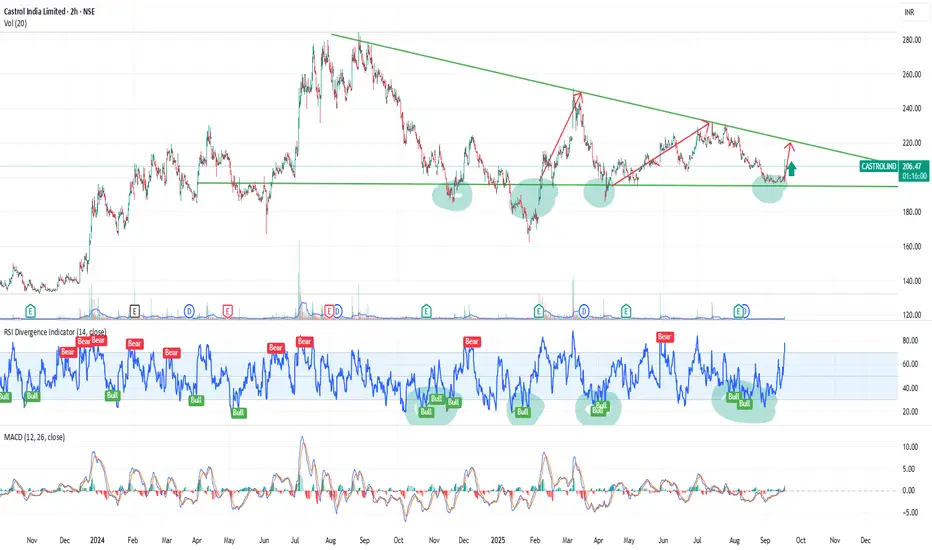
This chart showcases a symmetrical triangle pattern, where the price consolidates between two converging trendlines, indicating a period of market indecision. The formation of lower highs and higher lows suggests that the price is narrowing, setting up for a potential breakout.
Technically, the RSI is showing a bullish divergence as it rises from the oversold zone, while the MACD is crossing into positive territory, further supporting the possibility of an upward move. Volume indicators also highlight increasing interest, suggesting the potential for a breakout in the near term.
This is only view of my side by analysys of chart.
Note:
This analysis is purely for educational purposes and should not be considered as financial advice or a trading recommendation. Always conduct thorough research and consult a financial professional before making any trading decisions.
Trade aktif
As this stock has at level bottom which is its support and also fundmental is strong this stock. which would take this up in long term.Publikasi terkait
Pernyataan Penyangkalan
Informasi dan publikasi ini tidak dimaksudkan, dan bukan merupakan, saran atau rekomendasi keuangan, investasi, trading, atau jenis lainnya yang diberikan atau didukung oleh TradingView. Baca selengkapnya di Ketentuan Penggunaan.
Publikasi terkait
Pernyataan Penyangkalan
Informasi dan publikasi ini tidak dimaksudkan, dan bukan merupakan, saran atau rekomendasi keuangan, investasi, trading, atau jenis lainnya yang diberikan atau didukung oleh TradingView. Baca selengkapnya di Ketentuan Penggunaan.