Analysis:
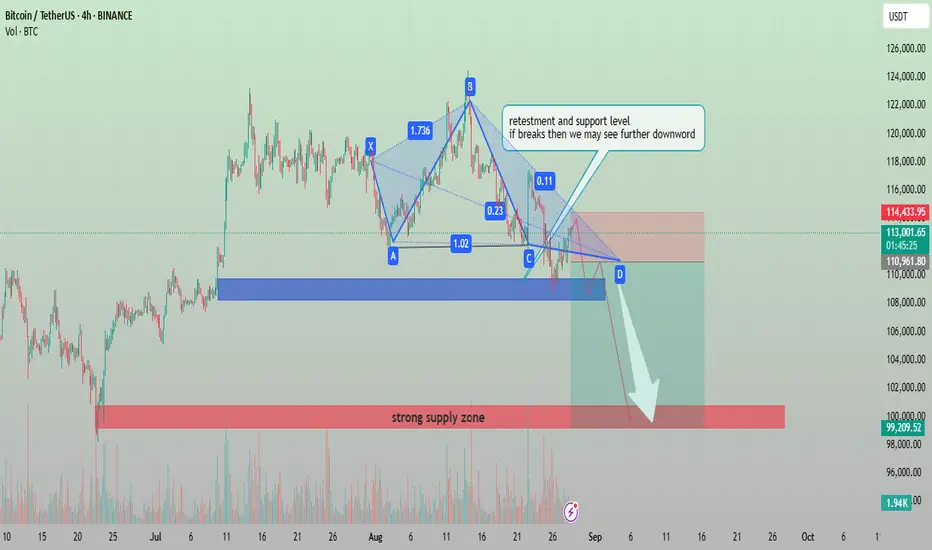
The chart shows Bitcoin (BTCUSDT) forming a harmonic pattern that signals potential bearish continuation. Price is currently retesting a critical support and resistance level around the 113,000–114,000 zone. If this level fails to hold, further downside movement is expected.
Pattern Formation: The harmonic structure (XABCD) suggests a bearish setup.
Support Zone: Around 110,900–111,000, a crucial level to watch.
Downside Target: If support breaks, the price could move toward the 99,000–100,000 strong supply zone.
Volume: A noticeable volume build-up supports potential continuation to the downside.
📉 Outlook: Bearish bias. A breakdown from current retest levels may accelerate selling pressure toward the 100k psychological zone.
join my telegram channel free
t.me/Pips_and_profits1
t.me/Pips_and_profits1
Daily 300+pips profits
weekly 2000+pips profit
High accuracy signals with double conformation
t.me/Pips_and_profits1
t.me/Pips_and_profits1
Daily 300+pips profits
weekly 2000+pips profit
High accuracy signals with double conformation
Publikasi terkait
Pernyataan Penyangkalan
Informasi dan publikasi tidak dimaksudkan untuk menjadi, dan bukan merupakan saran keuangan, investasi, perdagangan, atau rekomendasi lainnya yang diberikan atau didukung oleh TradingView. Baca selengkapnya di Persyaratan Penggunaan.