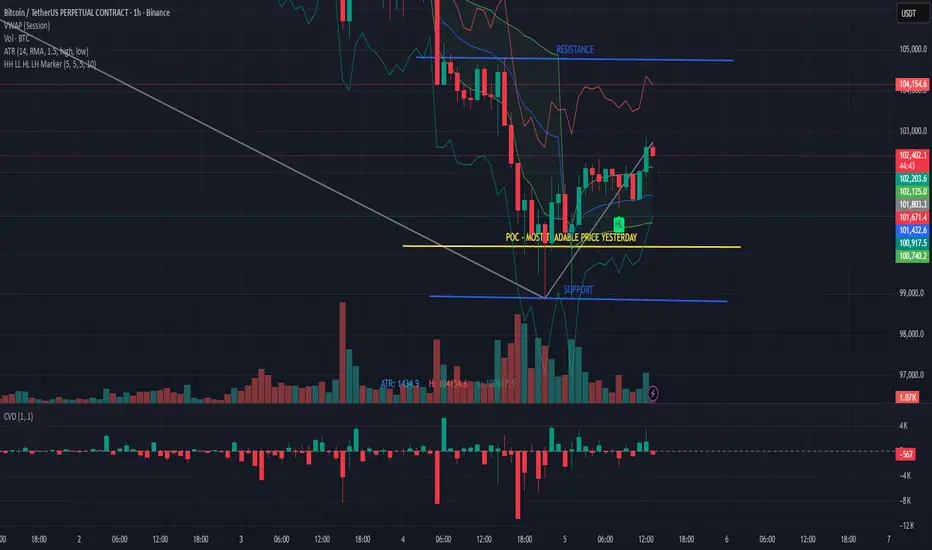
✅ What the chart is telling us
1) Strong Impulsive Down Move
Large bearish impulse candles
High selling volume
CVD deeply negative → aggressive sellers in control
Main trend is still down.
2) Reversal Reaction at Support Zone
At the local bottom we see:
Increased volume at lows ✔️
CVD flattening ✔️
Multiple failed breakdown attempts ✔️
This area shows buyers absorbing, shorts covering, and early longs stepping in.
3) First Higher Low (HL)
A Higher Low formed following a sharp drop.
✅ First sign of potential trend shift
❗Not a confirmed uptrend yet
To confirm a true reversal we need:
HL → done
HH → minor HH formed
Retest & hold → pending
So far this is only early recovery structure, not yet trend reversal confidence.
4) Key Level: POC + Value Area Low
Price is holding above yesterday’s POC — short-term bullish signal.
However, overhead we have:
Mid-range resistance
102.3–102.6 supply zone
Micro-value high cap
Price is pushing into resistance.
📊 1H Structure Summary
Element Status
Higher timeframe Downtrend
Current structure HL → minor HH
Volume Stabilizing
CVD Recovering (-9k → -380)
Location Retest of POC into supply
Bias Range → early accumulation signs
This is not a FOMO long spot.
This is a range recovery zone, not breakout continuation.
🎯 Trade Scenarios
🔥 Bullish scenario
Looking for:
Minor pullback
Hold 101.90–102.10
Break into 103,000 zone
Best long entry = HL retest after breakout, not here.
❄️ Bearish scenario
Short continuation if:
Price loses 101.90
Drops below Value Low
CVD flips down again
✅ Trader Game Plan
We do not chase here. Patience wins.
Looking for either:
Pullback to 1H demand + bounce → long scalp
Reject from 102.6 + LH on 5m → short continuation
Trade the reaction, not prediction.
Let the market show direction before committing.
📌 Conclusion
Buyers showed life — but still need to prove momentum.
Key levels
Bull defense: 102.0 – 101.9
Breakout confirmation: 102.6+
Bear continuation trigger: < 101.9
Now is the time to wait, not guess.
Patience ≠ weakness — it’s discipline.
Pernyataan Penyangkalan
Informasi dan publikasi tidak dimaksudkan untuk menjadi, dan bukan merupakan saran keuangan, investasi, perdagangan, atau rekomendasi lainnya yang diberikan atau didukung oleh TradingView. Baca selengkapnya di Persyaratan Penggunaan.
Pernyataan Penyangkalan
Informasi dan publikasi tidak dimaksudkan untuk menjadi, dan bukan merupakan saran keuangan, investasi, perdagangan, atau rekomendasi lainnya yang diberikan atau didukung oleh TradingView. Baca selengkapnya di Persyaratan Penggunaan.