Covering All Bases: Bitcoin Edition

Comment or PM me if anything is confusing. I'm just piggy backing on the TA I learn as I go. Obviously, there's an underlying sense of bullishness about this market. And of course, that sentiment could very well be wrong.
Catatan
Hey look, a parabola :)Catatan
no real update, I'm just so happy with my parabola... :DCatatan
look at the f'in difference... pricks....Catatan
don't worry about these little dips on the way up, this is exactly what we want. What we don't want are the sudden spikes and sudden drops, exne to the bart simposon head... we want to see retail investors returning to the marketCatatan
Now that Bitcoin is behaving, we're going to move our focus back to the 4hr and daily charts. The 4hr fractal we were previously tracking is ded. In its place we have a new matching fractal created by the last few days. The arrow points to the matching areas, and what we'd like to see on the daily chart next:Catatan
checking for a fractal match across timeframes, to verify that we are in syncCatatan
Catatan
Catatan
crazy how that works, right?Catatan
and there you have it, our repeating fractalCatatan
yes, we continue to have volatility, yes we continue to have market manipulation, but no one can beat the crowd, the curve has already started :)Catatan
So you guys realize that I have a particular theory about fractals. Well, one of my questions has been how are unnatural elements in the chart handled? To put it a more practical way, how does the market react to price manipulation? There were a couple of options 1) that the fractal would unfold as it naturally would, and ignore the unnatural parts, 2) it would somehow incorporate those unnatural parts and become a new fractal, or 3) it would iterate over and over and over again, until those unnatural parts somehow became a part of the fractal itself. I think the answer might be #3. Or to put more practically, the price manipulation is changing the way that market participants behave, and consequently the market itself. So, they killed my parabola overnight. I am more than upset. We get something back far uglier in return. We're heading up to 10.5k, then nosediving back down to god know where.Catatan
we might do a nose dive right now in fact, if we do, the target is 6600.Catatan
Let's hope that we go up, however bumpy it might be... and that market conditions improve by the time we get there, some regulations might be nice...Catatan
ummmm... nevermind, nature wins, we still moon, I'm looking for 9400 by the end of the day. If you haven't figured it out by now, you should take this for the entertainment value its providing, not as trading advice. But... 9400 :DCatatan
it looks like prices are about to drop right? it's not, we're going up shortly.Catatan
This will be a pretty big push up.... As for the answer to the question... I dont know what it is, but I think the solution was reached long before I recognized the problem as crazy as that sounds. Anyways, I guess I was too fixated on the price not going below 8330, sometimes you just gotta let go of your assumptions and open your mind.Catatan
hey what do you know, a parabola :)Catatan
I think I've refined this technique to the point of giving it a name... I shall call it "Fractal Curve Extrapolation"Catatan
ok, let's do this... synced again...Catatan
Catatan
Catatan
hey, what do you know, a parabola....Catatan
5 more minsCatatan
we started pumping again as expected from the synced fractals, albeit a small one. However, I'm still waiting on that parabola. Obviously, the image is from the 4hr, so it's going to take a while. As a side note, it's amazing how closely linked some charts in the crypto market are. For instance, my XMR chart from last month gives me more confidence that BTC is not going down and is, in fact, ready and able to moon:
Catatan
IF this drive fails, the fractals won't have an opportunity to sync like this until they hit the bottom of the triangle/the neckline of the HS, somewhere around 6600. Let's hope that doesn't happen. But, to drive home the point that people need to buy themselves some bitcoin (I just converted all my other holdings). If the fractal fails at 6600, I don't see another sync until 2k level, at which point this market is dead for at least a few years. Just remember, going down, the max you can make is 100% :)Catatan
as @hkh222 pointed out to me yesterday, we do have that bullish divergence on the RSICatatan
third time's the charm?Catatan
If this goes well aka as described above, I'll be starting a private Telegram group to provide updates, discuss the new TA technique, etc. That way I can stop pestering people with my updates :). PM me if you're a follower and you'd like the invitation link (even you wavy gravy).Catatan
we've created a nice support line on the 1min per the levels and zones indicator we're headed up to retest 8500Catatan
Catatan
a parabola, exactly what we wanted to seeCatatan
you can see how steep we're already starting to angleCatatan
The one hour has already started it's parabolaCatatan
the golden ratio tells me this as far as we dropCatatan
Catatan
8650 by 9/10 EST, if this fractal holds. then a dip back down to 8400ishCatatan
Catatan
oh god, I just read the note I wrote a month ago when doing the XMR chart above: "I think that the blue up slanting Inv H&S is a real possibility. Should that not happen and we get the down slanting inverse H&S instead, it will fail at the right shoulder, and we will have confirmation that we are inside of a much bigger symmetrical triangle."Catatan
sufficed to say, that would suckCatatan
god, I hope I was wrong...Catatan
due to fractal slanting (I'll explain to my telegram group later) we're still good...Catatan
well, that failed spectacularly, fortunately, we pick right back upCatatan
we have a show of support (circled in green). We did not have that the last timeCatatan
I'm attempting to show how this technique works. That these patterns will continue to repeat until one is completed. I'm not sure if I'm making that clear. I am also attempting to show that the pattern once formed will look like the overlay on the right aka validating my prediction and giving you a macro idea to follow based on a micro pattern.Catatan
the 1min made the same fractal at the end of the 5min fractal, I think this is it.Catatan
that was interesting, the 5min just morphed into a bigger version of the same patternCatatan
we're on our wayCatatan
I just noticed this...Catatan
fractals aren't exact, so let's hope that doesn't happen, but it is a possibility...Catatan
I was wrong, we're hitting 5/6k, sorryCatatan
more like 6600... but damnCatatan
Hopefully we go up for a little bit, but it will only be a few hundred then we will promptly drop back down. Where the trend lines intersect is our target ~6700Catatan
The speed at which we go up right now will determine how fast we recover after that dropCatatan
This possibility has been in the back of my mind for a while... I hoped it wasn't true...Catatan
Whether that's reality will depend on how fast this fractal goes up after it hits 8000Catatan
Because of the size of the fractal, this means that we could go up all the way to 8200/8400, but we would promptly fall right afterCatatan
you can see how low we might goCatatan
Trade aktif
As you would expect, I'm doing something risky. I'm ridding it up to 9500 then shorting down to 5500, then back to long. I'm doing it all with limit orders as I feel like Kraken will cease to work at the top and the bottom.Trading ditutup secara manual
This rocket ship ran out of fuel, this is a formation that cannot finish, the right shoulder is come down too lowCatatan
I got some really good advice from a follower yesterday. Don't let your emotions rule your judgment. I'm always wrong when I go against my gut instinct. Sometimes, I have to make up a reason for why that instinct is correct. Or, if that instinct seems to be flying in the face of what everyone's telling me, why that instinct is wrong. I see a repeating pattern on the day chart. It will probably take a few days to play out.Catatan
Catatan
There's absolutely nothing except instinct that's telling me those are matching fractals. Sometimes, you think too much. So, I'll take a different approach and come up with an explanation if, and that's a big if, those instincts pan outCatatan

Catatan
ummmm
Catatan
well, I'm just noticing that...Catatan
D4 is stealing all my ideas...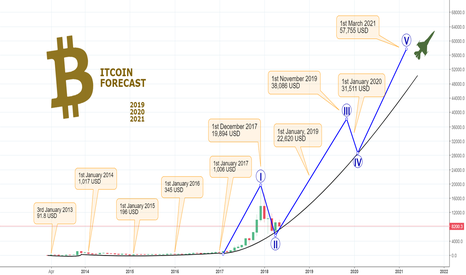
Catatan
Here's the new update. It incorporates several new ideas to come up with a tradeable path for Bitcoin
Pernyataan Penyangkalan
Informasi dan publikasi tidak dimaksudkan untuk menjadi, dan bukan merupakan saran keuangan, investasi, perdagangan, atau rekomendasi lainnya yang diberikan atau didukung oleh TradingView. Baca selengkapnya di Persyaratan Penggunaan.