Market Context & Structure:
Sideways Range Movement:
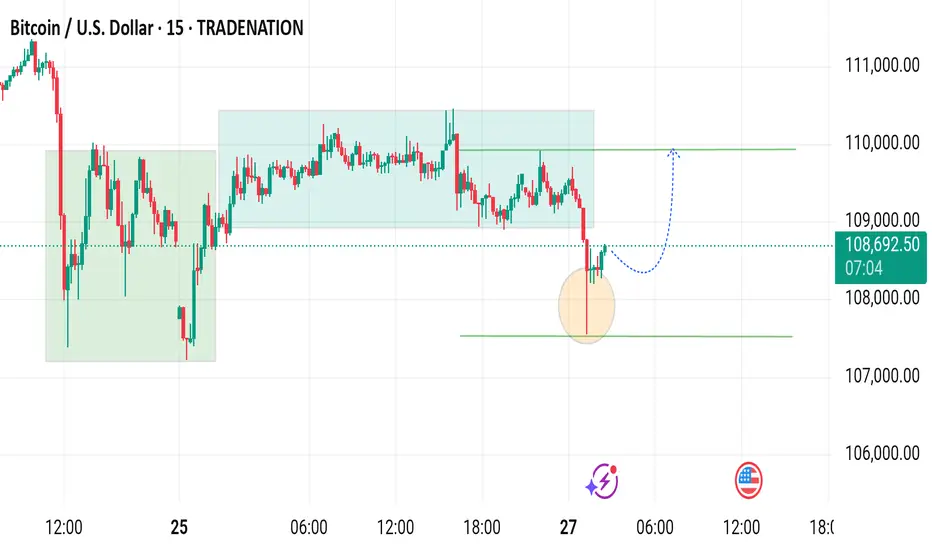
The chart shows two primary consolidation (range-bound) zones marked with green shaded rectangles. BTC has been trading within these horizontal zones for a considerable period, suggesting indecision or accumulation/distribution phases.
Current Breakdown:
Recently, BTC broke down from the upper consolidation range (~109,800–110,200 zone) and dipped below, forming a bearish move. This is confirmed by the red candles and the price moving out of the prior horizontal range.
---
Key Levels:
Resistance Zone: ~110,000
Marked by the upper green line and previous consolidation highs. This will likely act as resistance if price tries to move up again.
Support Zone: ~107,400
Marked by the lower green horizontal line. Price touched this area and bounced slightly (as shown by the highlighted circle).
---
Candlestick Patterns:
Bearish Momentum:
Multiple red candles indicate selling pressure. However, the recent candle shows a potential hammer-like recovery wick, suggesting some buyer interest near the support.
---
Projection (Dotted Line with Arrow):
The chart includes a bullish recovery scenario illustrated with a blue dotted line. This indicates a possible short-term reversal from the support area with a target to retest the previous resistance around 110,000.
---
Interpretation:
If Price Holds Above Support (107,400):
A potential bounce and retest of the 110,000 resistance is possible — a bullish reversal setup.
If Support Breaks Decisively:
Further downside may be expected, possibly toward 106,000 or lower. Sellers would gain control.
---
Trading Plan (Not Financial Advice):
Long Entry: Near 107,400 if bullish confirmation forms (e.g., bullish engulfing or higher low).
Stop Loss: Below 107,000 to limit downside.
Target: 109,800–110,200 zone.
Sideways Range Movement:
The chart shows two primary consolidation (range-bound) zones marked with green shaded rectangles. BTC has been trading within these horizontal zones for a considerable period, suggesting indecision or accumulation/distribution phases.
Current Breakdown:
Recently, BTC broke down from the upper consolidation range (~109,800–110,200 zone) and dipped below, forming a bearish move. This is confirmed by the red candles and the price moving out of the prior horizontal range.
---
Key Levels:
Resistance Zone: ~110,000
Marked by the upper green line and previous consolidation highs. This will likely act as resistance if price tries to move up again.
Support Zone: ~107,400
Marked by the lower green horizontal line. Price touched this area and bounced slightly (as shown by the highlighted circle).
---
Candlestick Patterns:
Bearish Momentum:
Multiple red candles indicate selling pressure. However, the recent candle shows a potential hammer-like recovery wick, suggesting some buyer interest near the support.
---
Projection (Dotted Line with Arrow):
The chart includes a bullish recovery scenario illustrated with a blue dotted line. This indicates a possible short-term reversal from the support area with a target to retest the previous resistance around 110,000.
---
Interpretation:
If Price Holds Above Support (107,400):
A potential bounce and retest of the 110,000 resistance is possible — a bullish reversal setup.
If Support Breaks Decisively:
Further downside may be expected, possibly toward 106,000 or lower. Sellers would gain control.
---
Trading Plan (Not Financial Advice):
Long Entry: Near 107,400 if bullish confirmation forms (e.g., bullish engulfing or higher low).
Stop Loss: Below 107,000 to limit downside.
Target: 109,800–110,200 zone.
t.me/htGGOLD_SOUK_Trd
🟢All Pairs Signals Provided
🟡XAUUSD AND CRYPTO
✅Just Register now and Enjoy
✅No swap & No commission
one.exnesstrack.org/a/siuhoykv4s
🟢All Pairs Signals Provided
🟡XAUUSD AND CRYPTO
✅Just Register now and Enjoy
✅No swap & No commission
one.exnesstrack.org/a/siuhoykv4s
Pernyataan Penyangkalan
Informasi dan publikasi tidak dimaksudkan untuk menjadi, dan bukan merupakan saran keuangan, investasi, perdagangan, atau rekomendasi lainnya yang diberikan atau didukung oleh TradingView. Baca selengkapnya di Persyaratan Penggunaan.