BITCOIN - Nice Short-Term Reversal Area @ $6666-$6780!

Hello followers and other TradingView users!
I would like to share my thoughts about one good short-term reversal point!
Long story short - reversal point criteria:
1. Fibonacci retracement level 62% (Pulled 24.06.2018-29.07.2018)
2. Fibonacci extension level 141% (Pulled 20.07 - 25-07)
3. Strong resistance area (more than 10 failed attempts to break the resistance from past) becomes a support area!
4. Trendline since 24.06.2018 with three touches and now waiting fourth!
5. Two types Elliot Wave complete the 5th wave! (a bigger is on the chart above and the smaller I put to the update section below this post)
6. ...and the MAGIC nr. area $6666 :)
7. Candlestick pattern
So, those are my criteria's to make BUY at this price level! Definitely, I want to wait for some candlestick pattern confirmation from this price level to confirm bullishness!
Hopefully, this helps You out a little bit to confirm Your own analysis! Definitely make Your own research and if You don't understand some of my points or I miss calculate something then please leave a comment!
To get updates - click the FOLLOW button and don't forget to LIKE, unless You don't appreciate it! ;)
Thank You for your support.
Catatan
"5. Two types Elliot Wave complete the 5th wave! (a bigger is on the chart above and the smaller I put to the update section below this post)"Here is the second one! Yes, maybe the starting point is incorrect but I try to learn this stuff, correct me if I made a mistake! Thank You!
Catatan
At the moment we have a broadening wedge! We have there clean HH's and HL. To confirm bearishness we need at least 1h candle close below the bottom trendline (black) and if we get close in this range then we have another confirmation - we have made new LL.Please don't forget to hit the LIKE button, thank You!
Catatan
We got close below the minor trendline (black line) but we didn’t make the lower low, very close! At the moment this would be a nice correction upwards and then down :), first level to watch is around $7050 where we have a smaller fibo 62% level and the bigger fibo 50% retest level! Looks like the pressure is still down but couple of hours we could see green candles but let’s see! This correction is good for our 6750 reversal level,Catatan
NO volume from buyers!!! And we made a lower low so, we heading to our reversal zone!Catatan
Another small bearish confirmation - in 1h chart bearish “Engulfin” candlestick patter!Catatan
...and don't forget to LIKE, unless You don't appreciate it! ;) Thank You for your support.
Catatan
Good morning!We are made a lower low and now we fighting with the trendline retest area! We have bounced several times already and made some bearish candlestick patterns on this price level but to continue the reversal zone direction then we have to break the red box area $6892-$6919! Several times we have bounced back up from this area and also we have two strong candles breakthrough - pump down, pump up :)
Also, we have a 4h candle close below the trendline but we have about 7 red 4h candle closes in the row so if we go right away to this $6750 area then it would be a very nice bounce upwards but if we wait some time then we could make some correction upwards (all corrections under $7090 is healthy)
Don't forget to LIKE, unless You don't appreciate it! ;)
Thank You for your support.
Have a nice day!
Catatan
"...and made some bearish candlestick patterns" - Here are those candlestick patterns! Bearish pattern Shooting Star and two in one tweezer and Railroad Tracks.Those candles have formed after the bounce from another strong area $6960-$6965!
Catatan
Here You can find some candlestick pattern definitions! Hopefully, You like this and don't forget to hit the LIKE button! Thank You!
Catatan
Meanwhile, in the BTC chart, we see some correction upwards like we suspect after this consistent selling but at the moment we have found some resistance from Fibo level and if this level holds us then we have made a lower high (LH) and all is correct but if we break above from here and make a new HH then I would like to watch this a bit closer ;)Catatan
We have a very nice bearish "Engulfing" candlestick pattern from the tested resistance level and from the 100EMA on the 1h timeframe! It could be mean that we could see some bearish action and buyers start to leave the market! This is just a sign and like You all already know, we aim the $6750 area for a bullish reversal. So, at the moment this is good when we see some bearish reactions!Catatan
Just have to share this feedback! Thank You!"Thank you Vaido, that makes perfect sense! Just wanna say you're my favourite author on this website, not only because you're a great analyst, but also because you're a super nice and friendly person who genuinely wants to help others. Finding your posts has restored my faith in humanity haha.
Have a nice day man!"
Catatan
"Like a hot knife through butter" :DAt the moment I wait for some bullish candlestick pattern, I just don't believe that we left this price level just as happens right now! Old and tested level $6419 held us and also round number $6500,so, here we might see some positive price action!
Catatan
2h and 3h candle close looks like "Hammers"Catatan
Now we have two candles close above the $6500 and two candles are bounced back from $6419 old support/resistance level! Here we could see some reaction, delayed reaction!Catatan
If somebody want's to know what price levels are worked from past then You can check my old topic, remember, always look left!!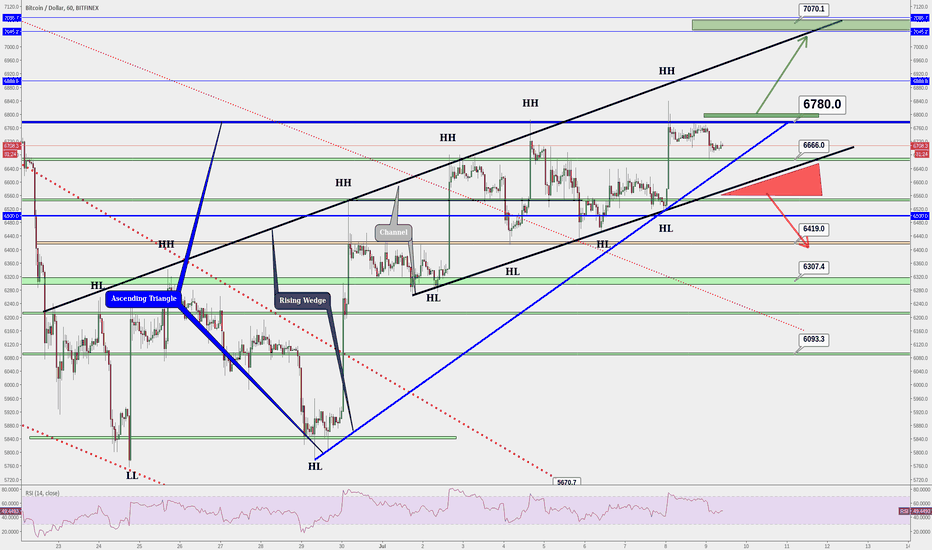
🔍I do the technicals - so You don’t have to.
📊Follow my research on Substack:
👉vaido.substack.com/ - ENG
👉vaidoveek.substack.com/ - EST
🚀 Actionable market analysis, ideas, and education
📊Follow my research on Substack:
👉vaido.substack.com/ - ENG
👉vaidoveek.substack.com/ - EST
🚀 Actionable market analysis, ideas, and education
Publikasi terkait
Pernyataan Penyangkalan
Informasi dan publikasi tidak dimaksudkan untuk menjadi, dan bukan merupakan saran keuangan, investasi, perdagangan, atau rekomendasi lainnya yang diberikan atau didukung oleh TradingView. Baca selengkapnya di Persyaratan Penggunaan.