BTAF_ai | Elliott Wave & AI Algorithm Analysis
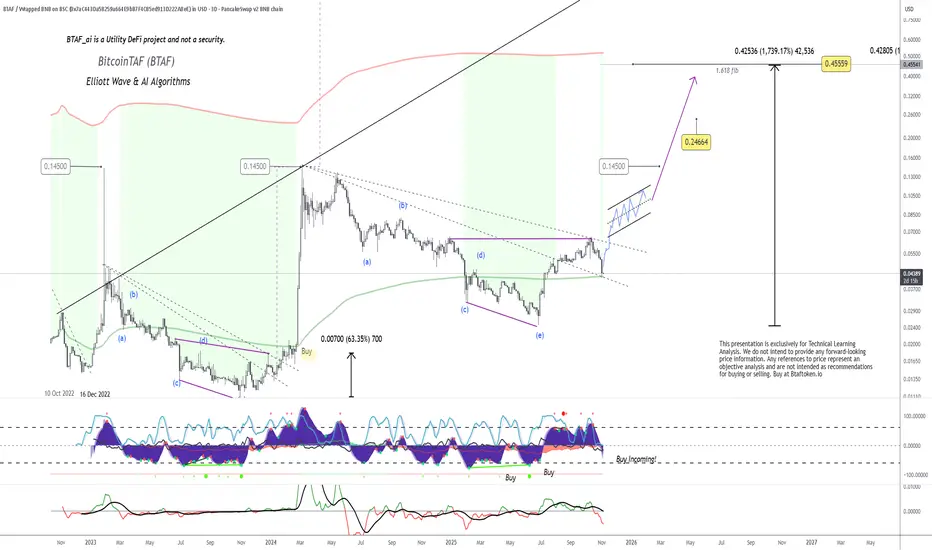
The chart illustrates BTAF’s current 3-Day structure with a strong Elliott Wave corrective completion (ABCDE) that mirrors the previous 2023 accumulation range. Each historical “Buy” signal shown on the oscillator preceded significant upside movements, often exceeding +600%.
We are again approaching a similar setup:
Current Price Zone: $0.04389 > this shows a BUY!
Wave Structure: Potential completion of Wave (e), signalling an early impulse phase.
Indicators: Multiple oscillators show bottoming conditions with “Buy Incoming!” confirmation.
Pattern: Breakout from the descending channel, forming an upward wedge, aligning with the next impulsive leg projection.
Targets (based on Fibonacci 1.618 extension):
Short-term: $0.14500
Mid-term: $0.24664
Long-term (1.618 fib): $0.425–$0.455 range (+1,700% zone)
Historically, the BTAF algorithmic patterns replicate after each deep corrective cycle, followed by steep exponential rallies. The structure now mirrors the March 2024 setup, which yielded a 63% initial surge before the full vertical run.
Observation:
If BTAF maintains support above the 200-MA and confirms the breakout above the wedge, this could initiate the next impulsive wave (1). Momentum indicators support early accumulation, and technical symmetry points to a sustained bullish cycle heading into 2026.
Disclaimer:
This presentation is exclusively for technical learning and algorithmic pattern recognition. It is not financial advice or a forecast. Always perform your own due diligence before trading
Marius Landman
Pernyataan Penyangkalan
Informasi dan publikasi tidak dimaksudkan untuk menjadi, dan bukan merupakan saran keuangan, investasi, perdagangan, atau rekomendasi lainnya yang diberikan atau didukung oleh TradingView. Baca selengkapnya di Persyaratan Penggunaan.
Marius Landman
Pernyataan Penyangkalan
Informasi dan publikasi tidak dimaksudkan untuk menjadi, dan bukan merupakan saran keuangan, investasi, perdagangan, atau rekomendasi lainnya yang diberikan atau didukung oleh TradingView. Baca selengkapnya di Persyaratan Penggunaan.