In trading, patterns on higher timeframes often carry deeper meaning.
What you’re seeing in this chart isn’t a forecast — it’s a learning opportunity.
Let’s break this down:
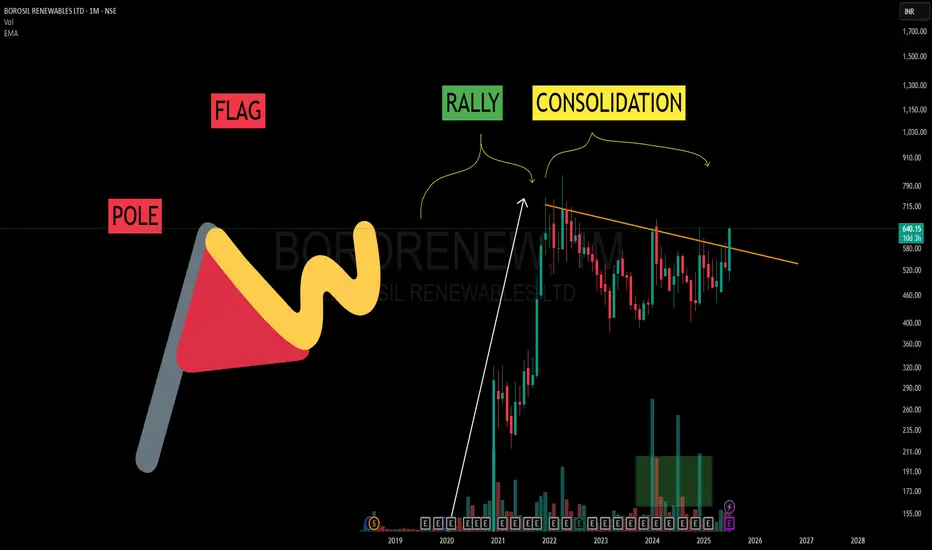
🔺 POLE:
This sharp rally from 2020–2022 represents a strong burst of momentum. That’s your Pole — it shows clean directional intent from market participants.
🏁 FLAG:
After the rally, price didn’t crash — it started consolidating. This sideways or slightly downward structure is known as the Flag.
It often appears as a phase of “cooling off” — traders taking profits, new buyers waiting.
📈 RALLY + CONSOLIDATION = Classic Flag & Pole
A rally followed by consolidation = textbook flag structure.
⏳ And here’s the takeaway:
When viewed on a Monthly (WTF - Way Too Far 😅) timeframe, these patterns take years to form. But that also means they carry weight.
No predictions here. Just learning.
Understanding market rhythm through structure > outcome can be your edge.
What you’re seeing in this chart isn’t a forecast — it’s a learning opportunity.
Let’s break this down:
🔺 POLE:
This sharp rally from 2020–2022 represents a strong burst of momentum. That’s your Pole — it shows clean directional intent from market participants.
🏁 FLAG:
After the rally, price didn’t crash — it started consolidating. This sideways or slightly downward structure is known as the Flag.
It often appears as a phase of “cooling off” — traders taking profits, new buyers waiting.
📈 RALLY + CONSOLIDATION = Classic Flag & Pole
A rally followed by consolidation = textbook flag structure.
⏳ And here’s the takeaway:
When viewed on a Monthly (WTF - Way Too Far 😅) timeframe, these patterns take years to form. But that also means they carry weight.
No predictions here. Just learning.
Understanding market rhythm through structure > outcome can be your edge.
🎯 Master My Self-Made Trading Strategy
📈 Telegram (Learn Today): t.me/hashtaghammer
✅ WhatsApp (Learn Today): wa.me/919455664601
📈 Telegram (Learn Today): t.me/hashtaghammer
✅ WhatsApp (Learn Today): wa.me/919455664601
Publikasi terkait
Pernyataan Penyangkalan
Informasi dan publikasi tidak dimaksudkan untuk menjadi, dan bukan merupakan saran keuangan, investasi, perdagangan, atau rekomendasi lainnya yang diberikan atau didukung oleh TradingView. Baca selengkapnya di Persyaratan Penggunaan.