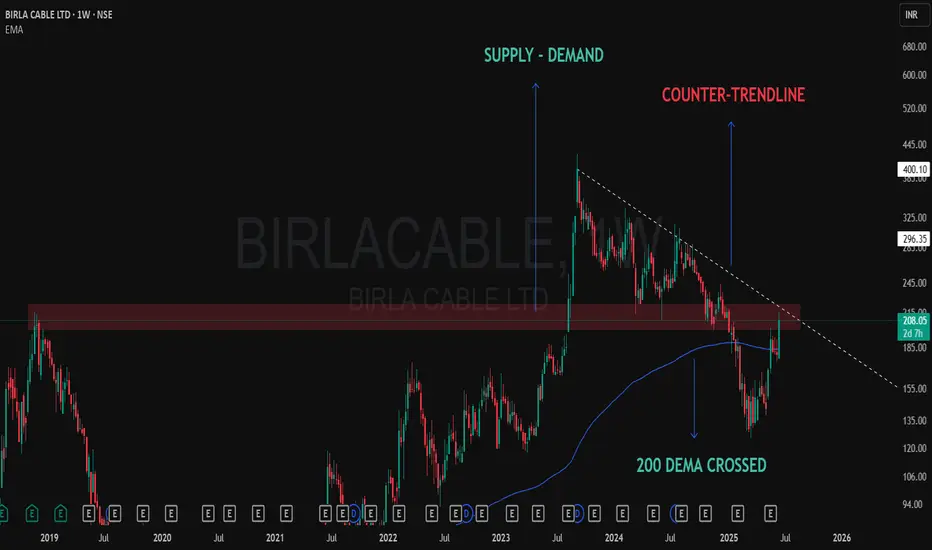
📈 BIRLA CABLE – Chart Talking Loud Now!
✅ 200 DEMA crossed
200 Dema was providing solid resistance and now taken out marked with blue line.
❌ At Counter-Trendline
Solid CT thrown from the top of the pattern, dotted white line shows that.
✅ Demand Zone Holding Strong
Clearly shown a solid supply zone which got converted into a Demand only after the Breakout some months back.
After months of consolidation and rejection from the same supply zone… price is now attacking with volume 🔥
🧠 “When structure aligns with emotionless patience, conviction follows.”
🎯 Master My Self-Made Trading Strategy
📈 Telegram (Learn Today): t.me/hashtaghammer
✅ WhatsApp (Learn Today): wa.me/919455664601
📈 Telegram (Learn Today): t.me/hashtaghammer
✅ WhatsApp (Learn Today): wa.me/919455664601
Publikasi terkait
Pernyataan Penyangkalan
Informasi dan publikasi ini tidak dimaksudkan, dan bukan merupakan, saran atau rekomendasi keuangan, investasi, trading, atau jenis lainnya yang diberikan atau didukung oleh TradingView. Baca selengkapnya di Ketentuan Penggunaan.