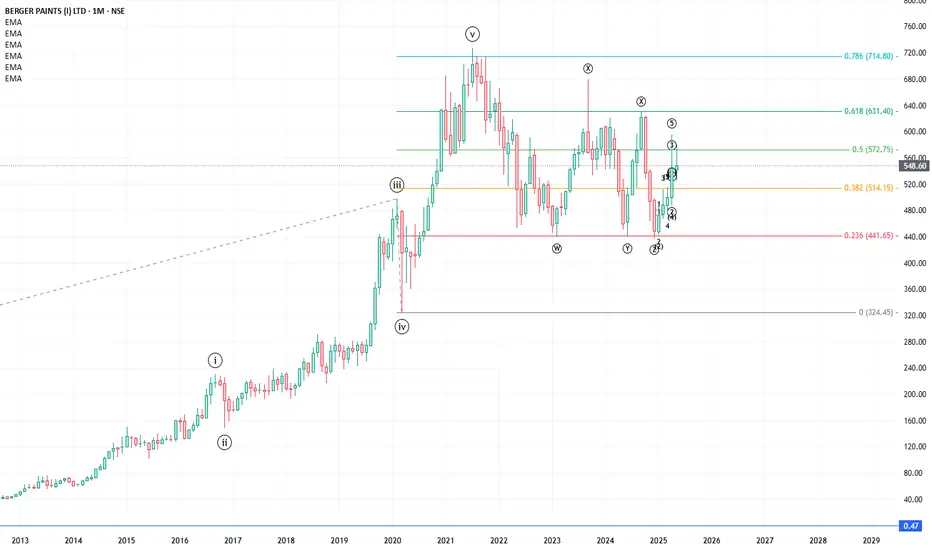
A stock after it reaches it 5th wave of larger degree undergoes either a price-wise correction or a time-wise correction or both. Here is a beautiful chart which depicts how Berger paint underwent a time-wise correction over 3 years as a WXYXZ pattern, concluding each wave at the same point.
Catatan
Each of wave w,y,z concluded at the fibo extension of wave (0-iii to iv) of 0.236. Actual correction started in July 21 and ended in Dec 24. ChartTheWave |
t.me/chartthewave
This channel is a common forum for "Elliott Wave Principle" enthusiasts, learners and practitioners. We aim to build a team of traders who practice EWP for common benefit; co-learn, teach, share, validate and benefit.
t.me/chartthewave
This channel is a common forum for "Elliott Wave Principle" enthusiasts, learners and practitioners. We aim to build a team of traders who practice EWP for common benefit; co-learn, teach, share, validate and benefit.
Pernyataan Penyangkalan
Informasi dan publikasi ini tidak dimaksudkan, dan bukan merupakan, saran atau rekomendasi keuangan, investasi, trading, atau jenis lainnya yang diberikan atau didukung oleh TradingView. Baca selengkapnya di Ketentuan Penggunaan.
ChartTheWave |
t.me/chartthewave
This channel is a common forum for "Elliott Wave Principle" enthusiasts, learners and practitioners. We aim to build a team of traders who practice EWP for common benefit; co-learn, teach, share, validate and benefit.
t.me/chartthewave
This channel is a common forum for "Elliott Wave Principle" enthusiasts, learners and practitioners. We aim to build a team of traders who practice EWP for common benefit; co-learn, teach, share, validate and benefit.
Pernyataan Penyangkalan
Informasi dan publikasi ini tidak dimaksudkan, dan bukan merupakan, saran atau rekomendasi keuangan, investasi, trading, atau jenis lainnya yang diberikan atau didukung oleh TradingView. Baca selengkapnya di Ketentuan Penggunaan.