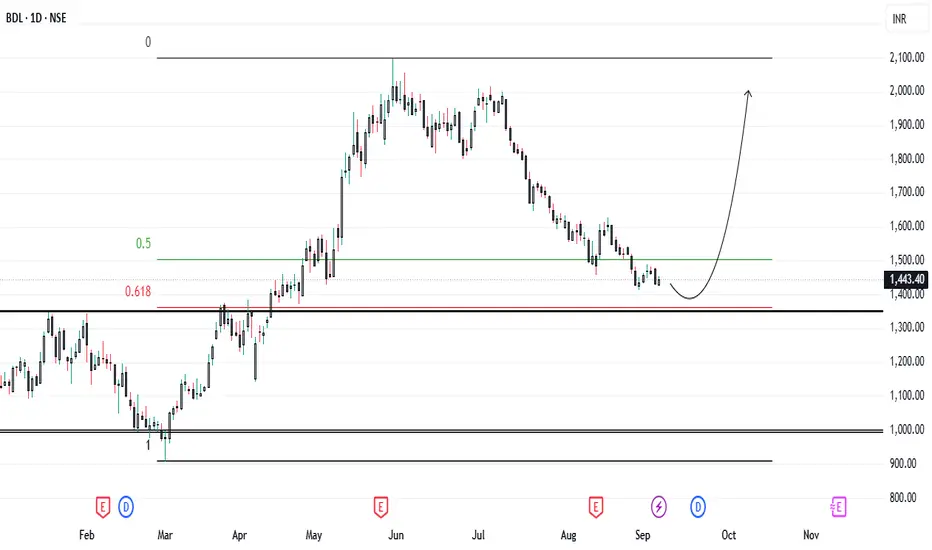
📊 Chart Observations (Daily Timeframe):
🔻 Recent Trend:
Stock has been in a steady downtrend since its June peak, witnessing consistent lower highs and lower lows.
🛑 Support Zone:
Current price (₹1,443) is hovering near the critical 0.618 Fibonacci retracement level (\~₹1,400) – a strong demand zone historically respected by buyers.
✅ Bullish Reversal Zone:
Price is showing signs of base-building around this key support, which could act as a springboard for a bounce.
📈 Resistance Levels to Watch:
* Immediate resistance: ₹1,500–₹1,550 (0.5 Fib level)
* Major upside target: ₹1,900–₹2,000 zone (previous supply area)
🕰️ Pattern Formation:
Chart hints at a potential U-shaped recovery if ₹1,400 holds firmly, aligning with the projected upward arrow shown.
🔑 Risk Management:
* Stoploss: Below ₹1,250 (clean invalidation level)
* Reward-to-Risk looks favorable with nearly 30–35% potential upside.
⚡ Key Takeaway
If BDL sustains above the ₹1,400–₹1,420 demand zone, we could see a strong reversal rally towards ₹2,000+ in the coming weeks. However, a breakdown below ₹1,250 may extend weakness toward ₹1,200 levels.
🔥 Trading Idea:
Buy on dips near ₹1,420–₹1,440 with SL ₹1,250
Target: ₹1,900–₹2,000
Pernyataan Penyangkalan
Informasi dan publikasi tidak dimaksudkan untuk menjadi, dan bukan merupakan saran keuangan, investasi, perdagangan, atau rekomendasi lainnya yang diberikan atau didukung oleh TradingView. Baca selengkapnya di Persyaratan Penggunaan.
Pernyataan Penyangkalan
Informasi dan publikasi tidak dimaksudkan untuk menjadi, dan bukan merupakan saran keuangan, investasi, perdagangan, atau rekomendasi lainnya yang diberikan atau didukung oleh TradingView. Baca selengkapnya di Persyaratan Penggunaan.