📊 Bank Nifty Trading Plan – 22-May-2025
Chart Timeframe: 15 Min | Reference Spot Price: 55,065.60
Gap Opening Threshold: 200+ points
🛡️ Risk Management Tips for Options Traders
✅ Avoid trading deep OTM options right after the open, especially if inside the No Trade Zone. Premium decay is faster in such zones.
✅ Set Stop Loss based on spot price action (not option premium). Let candles confirm your bias.
✅ Wait for breakout candle close (15-min/1-hour) before initiating trades.
✅ Position sizing is crucial—do not risk more than 1-2% of your capital on a single trade.
✅ Avoid revenge trading—if SL hits, wait and re-analyze instead of forcing trades.
✅ Book partial profits and trail SL in your favor to lock in gains on momentum moves.
📌 Summary & Conclusion
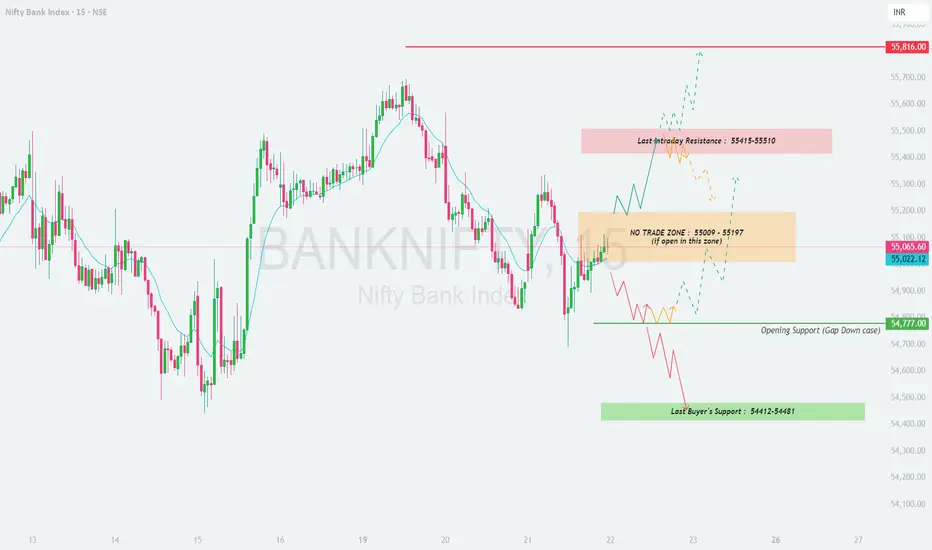
– No Trade Zone: 55,009 – 55,197
– Resistance Zone: 55,415 – 55,510 | Target Above: 55,816
– Opening Support: 54,777 | Major Buyer's Support: 54,412 – 54,481
– Avoid trading in choppy zones—wait for directional moves and confirmations.
– Let the first 15–30 minutes play out, especially in gap-up/gap-down scenarios.
💡 Key Principle: Patience is profitable. React to price, don’t predict it.
⚠️ Disclaimer:
I am not a SEBI-registered analyst. This trading plan is shared purely for educational and informational purposes. Please consult with a registered financial advisor before making any investment or trading decisions.
Chart Timeframe: 15 Min | Reference Spot Price: 55,065.60
Gap Opening Threshold: 200+ points
- 🚀 Gap-Up Opening (200+ Points Above Previous Close)
If Bank Nifty opens around 55,265+, price will likely open near or inside the Last Intraday Resistance Zone: 55,415 – 55,510.
🟥 This is a critical supply zone and may trigger profit-booking or reversal. Price action near this zone must be observed carefully before making any decision.
✅ If price breaks above 55,510 with strength and closes a 15-min candle above it, you may enter a long trade with a potential upside towards 55,816. This is the next probable target, as per price structure and wave projection.
🚫 If price shows rejection in the resistance zone (long upper wick, indecision candle, or bearish engulfing), consider this a sell-on-rise opportunity. The target on downside would be back to the “No Trade Zone” (55,009 – 55,197).
🎯 Plan of Action:
– Long only on confirmed breakout above 55,510.
– Short if price gets rejected and slips back below 55,265.
– Avoid indecisive price action; wait for clarity.
- 📈 Flat Opening (within ±200 Points)
If Bank Nifty opens between 54,870 – 55,200, it opens inside the No Trade Zone: 55,009 – 55,197.
🟧 This zone is usually filled with indecision, tight consolidation, and choppy price moves. Avoid initiating trades immediately in this range. Let the market break out or down from this zone for better clarity.
🟢 A bullish move above 55,197, followed by a strong candle close above 55,265, sets up a trade toward 55,415 – 55,510.
🔻 A breakdown below 55,009 and confirmation below 54,900 may trigger a short trade. You can then expect price to slide toward 54,777, and if this level breaks, further downside opens up to 54,412 – 54,481 (Buyer’s Support).
🎯 Plan of Action:
– Do not trade inside No Trade Zone.
– Trade breakout above 55,197 with target 55,415+.
– Trade breakdown below 55,009 with target 54,777 and 54,412.
- 📉 Gap-Down Opening (200+ Points Below Previous Close)
If Bank Nifty opens around 54,850 or lower, it is opening just above or inside the Opening Support: 54,777.
🟩 This level could act as short-term support. Watch for any reversal signs like bullish engulfing or hammer pattern near 54,777. If confirmed, a bounce toward 55,000 – 55,100 is possible.
⚠️ However, if price breaks and sustains below 54,777, you may see a fast fall toward the Last Buyer’s Support: 54,412 – 54,481. This is a major demand zone and could again offer reversal or bottom-fishing trades.
🔴 If even this green zone breaks, avoid longs and let price structure stabilize before considering re-entries.
🎯 Plan of Action:
– Look for reversal near 54,777 or 54,412–54,481 with proper bullish candles.
– Short trade below 54,777 if price sustains with volume.
– Avoid bottom-fishing unless clear reversal is visible.
🛡️ Risk Management Tips for Options Traders
✅ Avoid trading deep OTM options right after the open, especially if inside the No Trade Zone. Premium decay is faster in such zones.
✅ Set Stop Loss based on spot price action (not option premium). Let candles confirm your bias.
✅ Wait for breakout candle close (15-min/1-hour) before initiating trades.
✅ Position sizing is crucial—do not risk more than 1-2% of your capital on a single trade.
✅ Avoid revenge trading—if SL hits, wait and re-analyze instead of forcing trades.
✅ Book partial profits and trail SL in your favor to lock in gains on momentum moves.
📌 Summary & Conclusion
– No Trade Zone: 55,009 – 55,197
– Resistance Zone: 55,415 – 55,510 | Target Above: 55,816
– Opening Support: 54,777 | Major Buyer's Support: 54,412 – 54,481
– Avoid trading in choppy zones—wait for directional moves and confirmations.
– Let the first 15–30 minutes play out, especially in gap-up/gap-down scenarios.
💡 Key Principle: Patience is profitable. React to price, don’t predict it.
⚠️ Disclaimer:
I am not a SEBI-registered analyst. This trading plan is shared purely for educational and informational purposes. Please consult with a registered financial advisor before making any investment or trading decisions.
Pernyataan Penyangkalan
Informasi dan publikasi ini tidak dimaksudkan, dan bukan merupakan, saran atau rekomendasi keuangan, investasi, trading, atau jenis lainnya yang diberikan atau didukung oleh TradingView. Baca selengkapnya di Ketentuan Penggunaan.
Pernyataan Penyangkalan
Informasi dan publikasi ini tidak dimaksudkan, dan bukan merupakan, saran atau rekomendasi keuangan, investasi, trading, atau jenis lainnya yang diberikan atau didukung oleh TradingView. Baca selengkapnya di Ketentuan Penggunaan.