Detailed Market Structure Breakdown
4-Hour Chart (Macro Trend)
Structure: The Bank Nifty is in an accelerated corrective phase, trading below a clear descending channel. The price broke major support but found powerful buying interest at the 54,250 - 54,350 zone. This area is a key Bullish Order Block (OB) and a strong horizontal support.
Key Levels:
Major Supply (Resistance): 54,750 - 54,850. This area is now the immediate and most critical resistance, aligning with the FVG (Fair Value Gap) and a prior broken support.
Major Demand (Support): 54,250 - 54,350. This is the key "line in the sand." A sustained break below 54,250 would signal a deeper correction toward 53,500.
Outlook: The trend is strongly bearish, but the fierce defense of 54,250 on Monday suggests a temporary bottom may be in place.
1-Hour Chart (Intermediate View)
Structure: The 1H chart is bearish, confined to a descending channel. The market made a sharp move down, followed by a strong recovery, printing a large wick that penetrated the 54,250 demand zone. The strong rejection of lower prices indicates heavy buying.
Key Levels:
Immediate Resistance: The upper boundary of the descending channel, currently near 54,700.
Immediate Support: 54,250.
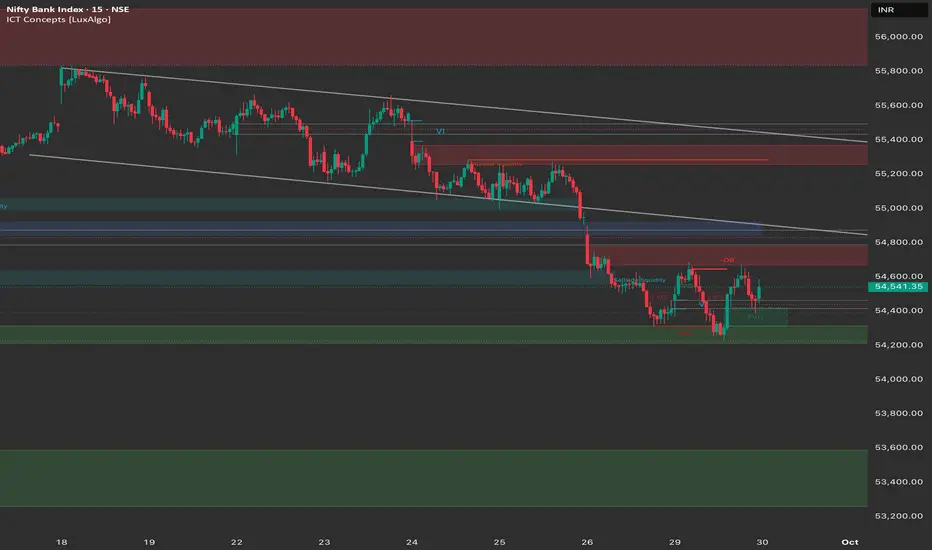
15-Minute Chart (Intraday View)
Structure: The 15M chart shows clear consolidation, forming a small bullish flag or pennant after the sharp recovery. The price is trading above the intraday FVG, which suggests a mild bullish bias for the short-term breakout.
Key Levels:
Intraday Supply: 54,750. This is the high of the recent consolidation and aligns with the major resistance.
Intraday Demand: 54,350. The immediate support level that must be defended.
Outlook: Neutral-to-Bullish for the session open, focused on a break of the tight consolidation.
Trade Plan (Tuesday, 30th September)
Market Outlook: The Bank Nifty is at a major support level. The strategy should be reactive, focusing on a breakout from the tight consolidation, with a strong emphasis on the 54,750 resistance.
Bullish Scenario (Bounce/Reversal Plan)
Justification: The strong defense of the 54,250 macro support and the tight consolidation pattern suggest buyers are ready for a counter-trend move.
Entry: Long entry on a decisive break and 15-minute candle close above 54,750 (breaking the resistance/FVG zone).
Stop Loss (SL): Below 54,500.
Targets:
T1: 55,000 (Psychological resistance).
T2: 55,250 (Major Order Block/Supply).
Bearish Scenario (Continuation Plan)
Justification: The continuation of the strong bearish trend, with the breakdown of the major support.
Entry: Short entry on a decisive break and 15-minute candle close below 54,250.
Stop Loss (SL): Place a stop loss above 54,450.
Targets:
T1: 54,000 (Psychological support).
T2: 53,500 - 53,750 (Next major demand zone).
Key Levels for Observation:
Immediate Decision Point: The 54,350 - 54,750 zone.
Bearish Confirmation: A break and sustained move below 54,250.
Bullish Confirmation: A recapture of the 54,750 level.
Line in the Sand: 54,250. The overall bullish structure remains intact only if this level holds.
4-Hour Chart (Macro Trend)
Structure: The Bank Nifty is in an accelerated corrective phase, trading below a clear descending channel. The price broke major support but found powerful buying interest at the 54,250 - 54,350 zone. This area is a key Bullish Order Block (OB) and a strong horizontal support.
Key Levels:
Major Supply (Resistance): 54,750 - 54,850. This area is now the immediate and most critical resistance, aligning with the FVG (Fair Value Gap) and a prior broken support.
Major Demand (Support): 54,250 - 54,350. This is the key "line in the sand." A sustained break below 54,250 would signal a deeper correction toward 53,500.
Outlook: The trend is strongly bearish, but the fierce defense of 54,250 on Monday suggests a temporary bottom may be in place.
1-Hour Chart (Intermediate View)
Structure: The 1H chart is bearish, confined to a descending channel. The market made a sharp move down, followed by a strong recovery, printing a large wick that penetrated the 54,250 demand zone. The strong rejection of lower prices indicates heavy buying.
Key Levels:
Immediate Resistance: The upper boundary of the descending channel, currently near 54,700.
Immediate Support: 54,250.
15-Minute Chart (Intraday View)
Structure: The 15M chart shows clear consolidation, forming a small bullish flag or pennant after the sharp recovery. The price is trading above the intraday FVG, which suggests a mild bullish bias for the short-term breakout.
Key Levels:
Intraday Supply: 54,750. This is the high of the recent consolidation and aligns with the major resistance.
Intraday Demand: 54,350. The immediate support level that must be defended.
Outlook: Neutral-to-Bullish for the session open, focused on a break of the tight consolidation.
Trade Plan (Tuesday, 30th September)
Market Outlook: The Bank Nifty is at a major support level. The strategy should be reactive, focusing on a breakout from the tight consolidation, with a strong emphasis on the 54,750 resistance.
Bullish Scenario (Bounce/Reversal Plan)
Justification: The strong defense of the 54,250 macro support and the tight consolidation pattern suggest buyers are ready for a counter-trend move.
Entry: Long entry on a decisive break and 15-minute candle close above 54,750 (breaking the resistance/FVG zone).
Stop Loss (SL): Below 54,500.
Targets:
T1: 55,000 (Psychological resistance).
T2: 55,250 (Major Order Block/Supply).
Bearish Scenario (Continuation Plan)
Justification: The continuation of the strong bearish trend, with the breakdown of the major support.
Entry: Short entry on a decisive break and 15-minute candle close below 54,250.
Stop Loss (SL): Place a stop loss above 54,450.
Targets:
T1: 54,000 (Psychological support).
T2: 53,500 - 53,750 (Next major demand zone).
Key Levels for Observation:
Immediate Decision Point: The 54,350 - 54,750 zone.
Bearish Confirmation: A break and sustained move below 54,250.
Bullish Confirmation: A recapture of the 54,750 level.
Line in the Sand: 54,250. The overall bullish structure remains intact only if this level holds.
Pernyataan Penyangkalan
Informasi dan publikasi ini tidak dimaksudkan, dan bukan merupakan, saran atau rekomendasi keuangan, investasi, trading, atau jenis lainnya yang diberikan atau didukung oleh TradingView. Baca selengkapnya di Ketentuan Penggunaan.
Pernyataan Penyangkalan
Informasi dan publikasi ini tidak dimaksudkan, dan bukan merupakan, saran atau rekomendasi keuangan, investasi, trading, atau jenis lainnya yang diberikan atau didukung oleh TradingView. Baca selengkapnya di Ketentuan Penggunaan.