Hello?
Traders, welcome.
If you "Follow", you can always get new information quickly.
Please also click "Boost".
Have a good day.
Thanks for your feedback on the dark mode, I made the chart in black as much as possible to match the colors used in the chart.
Please leave your thoughts on this in the comments.
-------------------------------------
(AVAXBTC 1W Chart)

If it fails to rise above 0.0008 602, I would expect a sharp decline.
--------------------------------------

------------------------------------------
(AVAXUSDT 1W Chart)

The HA-High indicator is looking to be created on 17.15.
Therefore, the key is whether it can be supported around 17.15.
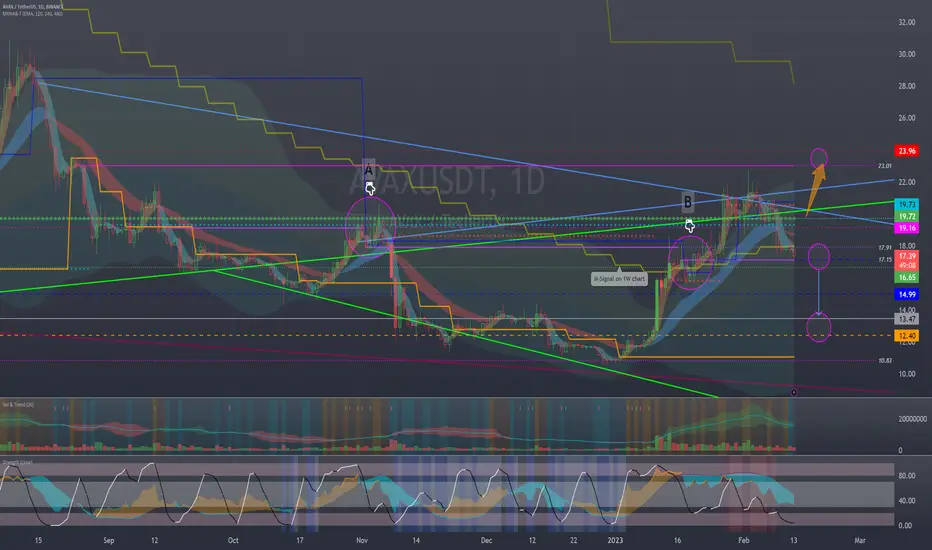
(1D chart)
Being supported and able to rise around 16.65-17.91 is important.
If not, I expect it to decline around 13.47.
-------------------------------------------------- -------------------------------------------
** All descriptions are for reference only and do not guarantee profit or loss in investment.
** If you share this chart, you can use the indicators normally.
** The MRHAB-T indicator includes indicators that indicate points of support and resistance.
** Check the formulas for the MS-Signal, HA-Low, and HA-High indicators at (tradingview.com/script/OUA6XoS6-HeikinAshi-MS-Signal-HA-MS/).
(Short-term Stop Loss can be said to be a point where profit or loss can be preserved or additional entry can be made by split trading. This is a short-term investment perspective.)
---------------------------------
Traders, welcome.
If you "Follow", you can always get new information quickly.
Please also click "Boost".
Have a good day.
Thanks for your feedback on the dark mode, I made the chart in black as much as possible to match the colors used in the chart.
Please leave your thoughts on this in the comments.
-------------------------------------
(AVAXBTC 1W Chart)
If it fails to rise above 0.0008 602, I would expect a sharp decline.
--------------------------------------
------------------------------------------
(AVAXUSDT 1W Chart)
The HA-High indicator is looking to be created on 17.15.
Therefore, the key is whether it can be supported around 17.15.
(1D chart)
Being supported and able to rise around 16.65-17.91 is important.
If not, I expect it to decline around 13.47.
-------------------------------------------------- -------------------------------------------
** All descriptions are for reference only and do not guarantee profit or loss in investment.
** If you share this chart, you can use the indicators normally.
** The MRHAB-T indicator includes indicators that indicate points of support and resistance.
** Check the formulas for the MS-Signal, HA-Low, and HA-High indicators at (tradingview.com/script/OUA6XoS6-HeikinAshi-MS-Signal-HA-MS/).
(Short-term Stop Loss can be said to be a point where profit or loss can be preserved or additional entry can be made by split trading. This is a short-term investment perspective.)
---------------------------------
※ Follow X to check out the posts.
※ X를 팔로우하고 게시물을 확인하세요.
◆ t.me/readCryptoChannel
[HA-MS Indicator]
bit.ly/3YxHgvN
[OBV Indicator]
bit.ly/4dcyny3
※ X를 팔로우하고 게시물을 확인하세요.
◆ t.me/readCryptoChannel
[HA-MS Indicator]
bit.ly/3YxHgvN
[OBV Indicator]
bit.ly/4dcyny3
Publikasi terkait
Pernyataan Penyangkalan
Informasi dan publikasi tidak dimaksudkan untuk menjadi, dan bukan merupakan saran keuangan, investasi, perdagangan, atau rekomendasi lainnya yang diberikan atau didukung oleh TradingView. Baca selengkapnya di Persyaratan Penggunaan.