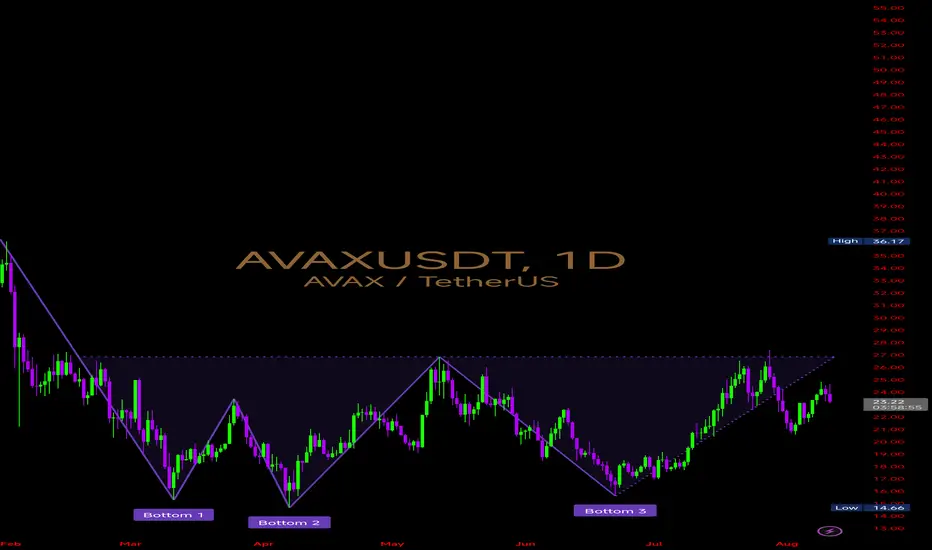
The chart is displaying a Triple Bottom reversal structure — a bullish formation that often signals trend exhaustion on the downside and the potential for a sustained uptrend if neckline resistance is breached.
🔹Triple Bottom Lows: $14.66 (Bottom 3), $15.20 (Bottom 2), $15.50 (Bottom 1) — strong accumulation zone
🔸Neckline Resistance: ~$25.80 – $26.00 — the key breakout trigger zone
🔹Immediate Support: $21.80 – $22.20 (former swing high support)
🔸Macro Resistance above Neckline: $28.50 – $30.00 zone
The three clean retests of the $14–15 region show strong buyer defense, signaling value accumulation
Current price action is in the mid-range between the neckline and recent support, with momentum recovering after the latest pullback
The pattern height (neckline to bottoms) suggests a sizeable upside potential if a breakout occurs
Volume expansion will be critical — breakouts without it risk turning into bull traps
⚡ Probable Scenarios
1. Bullish Continuation: Daily close above $26.00 with volume could confirm the Triple Bottom breakout, opening the door for a measured move toward the $36–38 zone
2. Range Continuation: Failure to clear $26.00 may keep
3. Bearish Breakdown: A close below $21.80 would weaken the setup, potentially dragging price toward the $19.00–$20.00 area for a deeper retest
Conclusion : The structure leans bullish, but the $26 neckline is the key battleground. A decisive reclaim above it could flip the long-term trend, while repeated rejections may keep #AVAX consolidating.
Pernyataan Penyangkalan
Informasi dan publikasi tidak dimaksudkan untuk menjadi, dan bukan merupakan saran keuangan, investasi, perdagangan, atau rekomendasi lainnya yang diberikan atau didukung oleh TradingView. Baca selengkapnya di Persyaratan Penggunaan.
Pernyataan Penyangkalan
Informasi dan publikasi tidak dimaksudkan untuk menjadi, dan bukan merupakan saran keuangan, investasi, perdagangan, atau rekomendasi lainnya yang diberikan atau didukung oleh TradingView. Baca selengkapnya di Persyaratan Penggunaan.