Description:
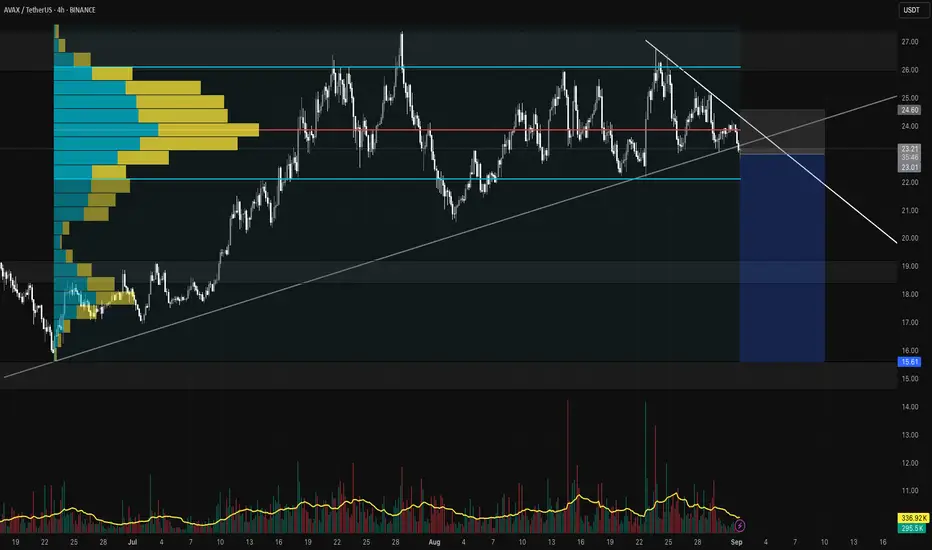
AVAX is currently testing a critical trendline support around the $23 zone. Price has been consolidating within a descending triangle structure, with lower highs pressing down and a flat support zone being tested multiple times.
The Volume Profile (VPVR) shows heavy volume concentration between $23 – $25, suggesting this area has acted as a major battleground for buyers and sellers. A breakdown from here indicates that demand is weakening, opening the door for a deeper move to lower value areas.
Resistance Zones: $24.60 – $25.00 (supply overhead, capped by descending trendline)
Support Zones (Targets):
TP1: $19.20 (first key volume node / demand zone)
Final TP: $15.60 (major liquidity area & historical support)
Trade Idea:
If AVAX fails to reclaim above $23.50 – $24.00 and continues lower, a short setup could unfold toward the mentioned target zones. TP1 at $19.20 is the first demand zone to watch, while the final downside target rests near $15.60.
The Volume Profile significance here is that once price loses the high-volume support ($23 – $24), it may quickly travel toward lower-volume regions, as there is less historical trading activity to provide support.
Key Notes:
Break and close below trendline = bearish continuation.
Volume confirmation on breakdown will add conviction.
Manage risk properly, as false breakdowns are possible.
Happy Trading, Best Regards!-Harshit
Disclaimer: This is not financial advice. Please do your own analysis before entering any trade.
Pernyataan Penyangkalan
Informasi dan publikasi tidak dimaksudkan untuk menjadi, dan bukan merupakan saran keuangan, investasi, perdagangan, atau rekomendasi lainnya yang diberikan atau didukung oleh TradingView. Baca selengkapnya di Persyaratan Penggunaan.
Pernyataan Penyangkalan
Informasi dan publikasi tidak dimaksudkan untuk menjadi, dan bukan merupakan saran keuangan, investasi, perdagangan, atau rekomendasi lainnya yang diberikan atau didukung oleh TradingView. Baca selengkapnya di Persyaratan Penggunaan.