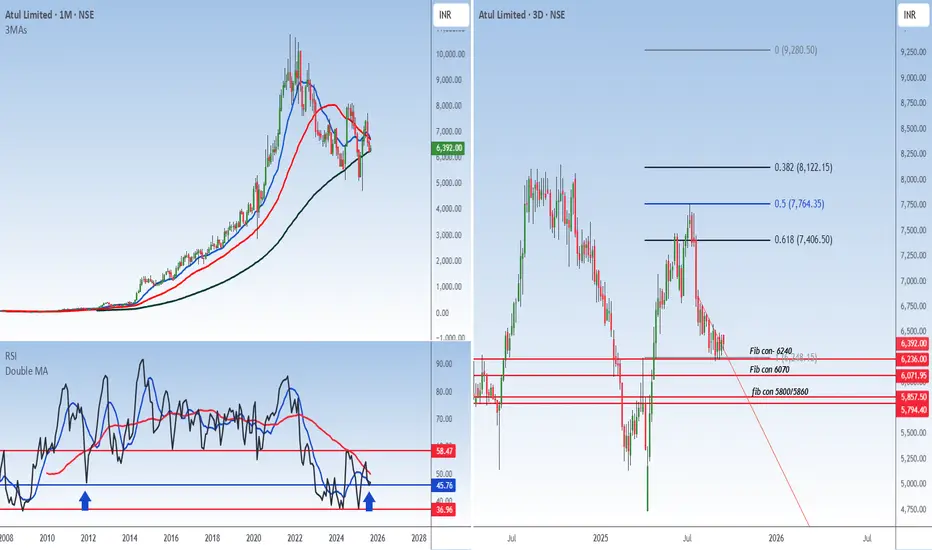
Atul Ltd Technical Analysis (CMP: 6392)
Elliott Wave Analysis: The stock appears to be initiating its 3rd wave, which typically signifies a strong and rapid price movement.
Fibonacci Analysis: To manage risk, stops should be placed below the Fibonacci confluence zones.
Moving Averages: The convergence of all MAs indicates the stock is poised for a directional move.
RSI Analysis: The RSI is at previous bull zone support, and the MA on RSI is converging, further suggesting an imminent directional move.
Conclusion: With these indicators aligning, I anticipate a strong move in Atul Ltd, targeting 9000 as the first milestone.
Pernyataan Penyangkalan
Informasi dan publikasi tidak dimaksudkan untuk menjadi, dan bukan merupakan saran keuangan, investasi, perdagangan, atau rekomendasi lainnya yang diberikan atau didukung oleh TradingView. Baca selengkapnya di Persyaratan Penggunaan.
Pernyataan Penyangkalan
Informasi dan publikasi tidak dimaksudkan untuk menjadi, dan bukan merupakan saran keuangan, investasi, perdagangan, atau rekomendasi lainnya yang diberikan atau didukung oleh TradingView. Baca selengkapnya di Persyaratan Penggunaan.