📊 Overview
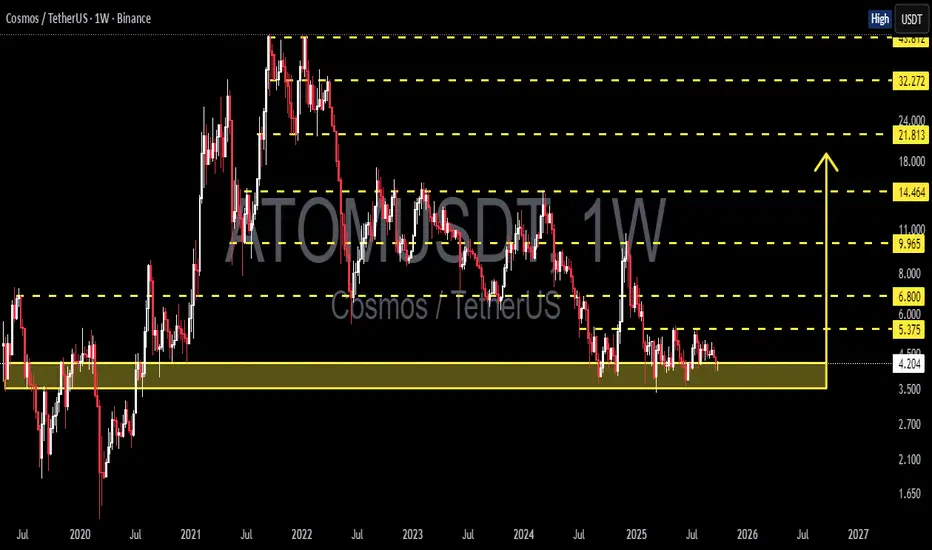
The Cosmos (ATOM/USDT) Weekly chart is at a decisive point. Price is currently sitting inside the historical support zone around 3.5 – 4.5 USDT, which has acted as a strong defense since 2020. Every time ATOM touched this area, a rebound followed — but this time the repeated tests suggest the support is getting weaker.
The macro structure still shows a pattern of lower highs since the 2021 peak, indicating a dominant bearish bias. However, the prolonged pressure has also pushed ATOM into an attractive long-term accumulation zone — if the support holds.
---
🔑 Key Technical Levels
Main Support Zone (Current): 3.5 – 4.5 USDT
Next Support: 2.7 USDT (structural low from 2020)
Resistance 1: 5.375 USDT
Resistance 2: 6.800 USDT
Resistance 3: 9.965 USDT
Major Resistances: 14.464 – 21.813 – 32.272 – 45.612 USDT
These levels provide the roadmap for ATOM’s mid-to-long-term direction.
---
🟢 Bullish Scenario
1. Confirmation: a weekly close above 5.375 – 5.5 USDT with strong volume.
2. Implication: signals that selling pressure is fading and the support zone has held.
3. Targets:
Initial: 6.8 USDT
Mid-term: 9.965 USDT
Extended: 14.4 – 21.8 USDT if market momentum strengthens.
4. Pattern potential: a double bottom or accumulation base may form if the zone continues to hold and buyers step in aggressively.
---
🔴 Bearish Scenario
1. Confirmation: a weekly close below 3.5 USDT.
2. Implication: breakdown of historical support → opens the path for deeper downside.
3. Targets:
First: 2.7 USDT (2020 structural support).
Extended: 2.1 – 1.6 USDT if selling accelerates.
4. Warning: repeated testing of the same support weakens it, making a breakdown scenario highly possible if buyers fail to defend.
---
📌 Structure & Pattern Insights
Horizontal consolidation within support zone, small weekly candles → market indecision.
Lower highs keep pressuring the structure downward.
Potential double bottom if ATOM holds above 3.5 and reverses strongly.
Beware of false breaks — always confirm with volume and retest.
---
🎯 Trader & Investor Takeaways
Short-term traders: watch closely for reaction inside 3.5–4.5. Aggressive entries possible here with tight stops below 3.3. Safer entries only after a weekly close above 5.5.
Long-term investors: this zone is historically a strong accumulation area, but patience and risk management are crucial due to breakdown risks.
Strategy: scale into positions gradually, risk max 1–2% per trade, and rely on weekly confirmation.
---
📝 Conclusion
ATOM is at a crossroads. Holding the 3.5–4.5 support zone could spark a rebound toward 6.8 – 10 USDT, while a confirmed breakdown below 3.5 would expose ATOM to 2.7 or even lower.
The next weekly close will likely decide the medium-term trend. ATOM now stands like a last fortress under siege — either it defends and rallies, or it crumbles into deeper lows.
---
#ATOM #Cosmos #ATOMUSDT #Crypto #TechnicalAnalysis #PriceAction #SupportResistance #CryptoMarket #SwingTrading #InvestInCrypto
✅ Get Free Signals! Join Our Telegram Channel Here: t.me/TheCryptoNuclear
✅ Twitter: twitter.com/crypto_nuclear
✅ Join Bybit : partner.bybit.com/b/nuclearvip
✅ Benefits : Lifetime Trading Fee Discount -50%
✅ Twitter: twitter.com/crypto_nuclear
✅ Join Bybit : partner.bybit.com/b/nuclearvip
✅ Benefits : Lifetime Trading Fee Discount -50%
Pernyataan Penyangkalan
Informasi dan publikasi tidak dimaksudkan untuk menjadi, dan bukan merupakan saran keuangan, investasi, perdagangan, atau rekomendasi lainnya yang diberikan atau didukung oleh TradingView. Baca selengkapnya di Persyaratan Penggunaan.