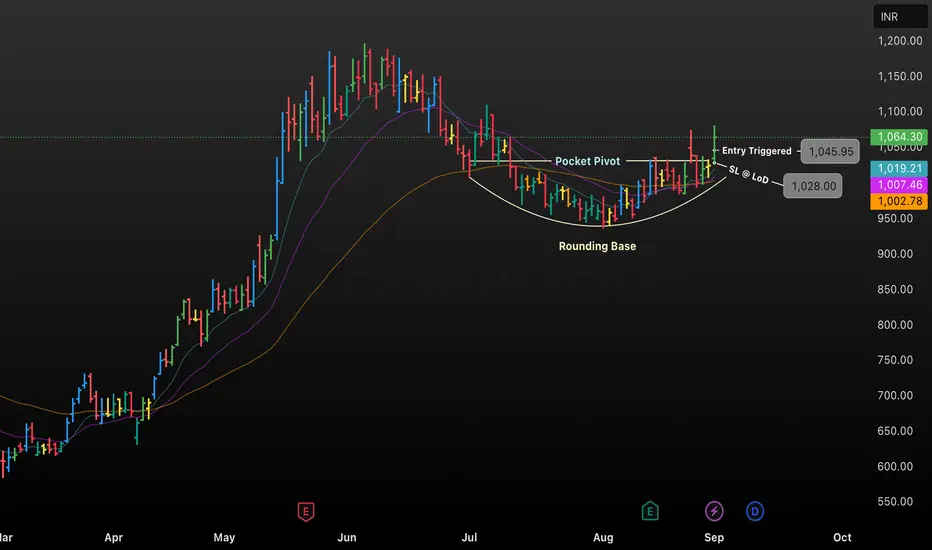
This chart from TradingView displays the price movement of ASTRAMICRO (ASTRAM) in INR over a period from March to September 2025, highlighting key technical features and trade signals.
• The chart illustrates a Rounding Base pattern forming from June through August, which suggests a period of consolidation and accumulation before a possible breakout.
• A Pocket Pivot is marked, indicating a strong buy signal based on above-average volume and price strength within the base pattern.
• The Entry Triggered level is annotated at ₹1,045.95, showing where a breakout occurred, with suggested stop-loss (SL) at the low of ₹1,028.00.
• Moving averages (colored lines) are shown for trend confirmation and support/resistance visualization, while prices are currently trading at ₹1,064.30, up 3.93% on the session.
• The chart is designed for momentum and breakout traders seeking to capitalize on price continuation following a base formation.
Pernyataan Penyangkalan
Informasi dan publikasi ini tidak dimaksudkan, dan bukan merupakan, saran atau rekomendasi keuangan, investasi, trading, atau jenis lainnya yang diberikan atau didukung oleh TradingView. Baca selengkapnya di Ketentuan Penggunaan.
Pernyataan Penyangkalan
Informasi dan publikasi ini tidak dimaksudkan, dan bukan merupakan, saran atau rekomendasi keuangan, investasi, trading, atau jenis lainnya yang diberikan atau didukung oleh TradingView. Baca selengkapnya di Ketentuan Penggunaan.