📊 Recent Price Snapshot
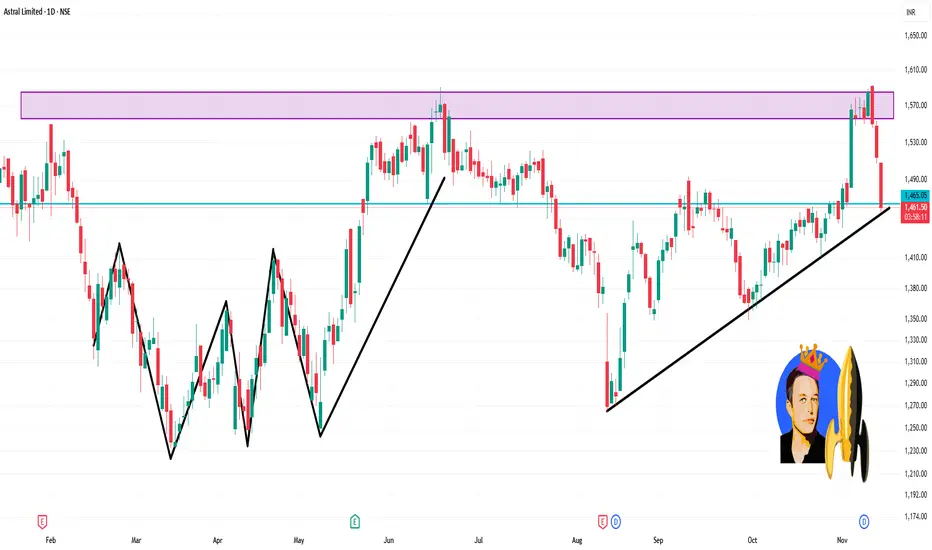
Latest closing around ₹1,460-₹1,470.
Daily range on latest day: High ~ ₹1,508, Low ~ ₹1,460.
52 week high ~ ₹1,867, 52 week low ~ ₹1,232.
🔍 Key Levels for the 1-Day Timeframe
Support Levels
Around ₹1,440–₹1,450: Recent lows touched ~1,445.
Further support nearer the 200-day SMA (~₹1,417) as per technical data.
Resistance Levels
Immediate resistance near ₹1,508 (recent high).
A stronger resistance zone around ₹1,520-₹1,550 (recent swing highs).
Price Action & Trend
The stock is trading above its 200-day average (~₹1,417) but the upward momentum appears weak.
On short term RSI/MFI metrics: MFI appears elevated (suggestive of some overbought behaviour).
Publikasi terkait
Pernyataan Penyangkalan
Informasi dan publikasi ini tidak dimaksudkan, dan bukan merupakan, saran atau rekomendasi keuangan, investasi, trading, atau jenis lainnya yang diberikan atau didukung oleh TradingView. Baca selengkapnya di Ketentuan Penggunaan.
Publikasi terkait
Pernyataan Penyangkalan
Informasi dan publikasi ini tidak dimaksudkan, dan bukan merupakan, saran atau rekomendasi keuangan, investasi, trading, atau jenis lainnya yang diberikan atau didukung oleh TradingView. Baca selengkapnya di Ketentuan Penggunaan.