📈 Current Price & Trading Range
Current Price: ₹2,357.70
Day’s Range: ₹2,337.00 – ₹2,366.60
Previous Close: ₹2,340.20
52-Week Range: ₹2,124.75 – ₹3,103.55
📊 Technical Indicators
RSI (14-day): 38.17 — indicating a neutral to bearish condition.
MACD: -41.59 — suggesting bearish momentum.
Stochastic RSI: 10.76 — points to an oversold condition, possibly signaling a reversal.
Rate of Change (ROC): -1.93 — reflects downward momentum.
Commodity Channel Index (CCI): -1.93 — supports the bearish outlook.
Average Directional Index (ADX): 32.54 — indicates a strong trend, confirming the downtrend.
Parabolic SAR: ₹2,320 — suggests a bearish trend continuation.
Supertrend: ₹2,444 — aligns with the bearish trend.
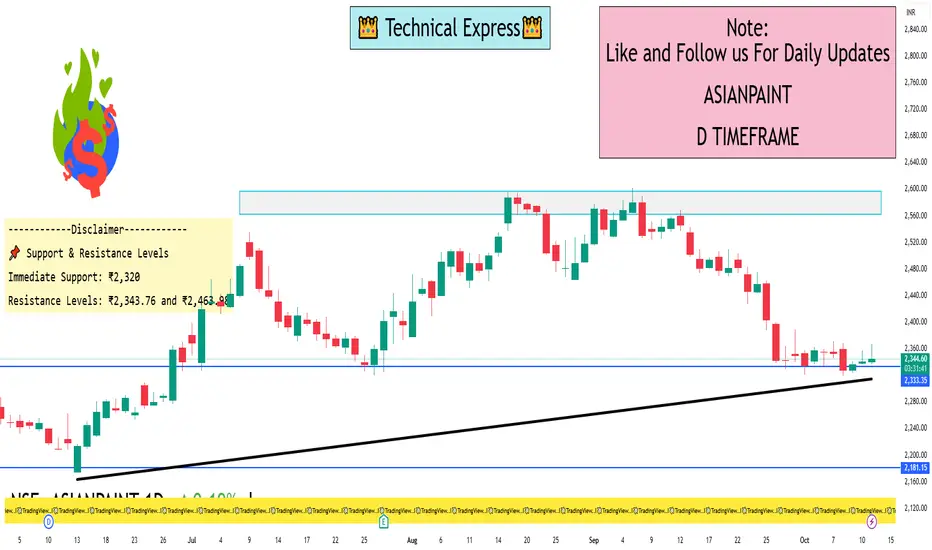
📌 Summary
Asian Paints Ltd. is currently in a bearish phase on the 1-day timeframe. Key support at ₹2,320 is crucial; a breach could lead to further declines. Conversely, a rebound above ₹2,463.98 might indicate a potential trend reversal.
Current Price: ₹2,357.70
Day’s Range: ₹2,337.00 – ₹2,366.60
Previous Close: ₹2,340.20
52-Week Range: ₹2,124.75 – ₹3,103.55
📊 Technical Indicators
RSI (14-day): 38.17 — indicating a neutral to bearish condition.
MACD: -41.59 — suggesting bearish momentum.
Stochastic RSI: 10.76 — points to an oversold condition, possibly signaling a reversal.
Rate of Change (ROC): -1.93 — reflects downward momentum.
Commodity Channel Index (CCI): -1.93 — supports the bearish outlook.
Average Directional Index (ADX): 32.54 — indicates a strong trend, confirming the downtrend.
Parabolic SAR: ₹2,320 — suggests a bearish trend continuation.
Supertrend: ₹2,444 — aligns with the bearish trend.
📌 Summary
Asian Paints Ltd. is currently in a bearish phase on the 1-day timeframe. Key support at ₹2,320 is crucial; a breach could lead to further declines. Conversely, a rebound above ₹2,463.98 might indicate a potential trend reversal.
I built a Buy & Sell Signal Indicator with 85% accuracy.
📈 Get access via DM or
WhatsApp: wa.link/d997q0
Contact - +91 76782 40962
| Email: techncialexpress@gmail.com
| Script Coder | Trader | Investor | From India
📈 Get access via DM or
WhatsApp: wa.link/d997q0
Contact - +91 76782 40962
| Email: techncialexpress@gmail.com
| Script Coder | Trader | Investor | From India
Publikasi terkait
Pernyataan Penyangkalan
Informasi dan publikasi ini tidak dimaksudkan, dan bukan merupakan, saran atau rekomendasi keuangan, investasi, trading, atau jenis lainnya yang diberikan atau didukung oleh TradingView. Baca selengkapnya di Ketentuan Penggunaan.