1. Understanding Implied Volatility (IV)
Implied Volatility is a metric derived from the market price of options that reflects the market’s expectations of future volatility in the price of the underlying asset. Unlike historical volatility, which measures past price fluctuations, IV is forward-looking—it tells us how much the market expects the asset to move in the future.
Key Characteristics of IV:
Expressed in percentage terms, showing the expected annualized movement in the underlying asset.
Does not predict direction—only the magnitude of expected price swings.
Higher IV means the market expects larger price movements (high uncertainty or fear).
Lower IV means smaller expected price movements (stability or complacency).
Factors Influencing Implied Volatility:
Market sentiment: During uncertainty or events like elections, budgets, or economic announcements, IV tends to rise.
Supply and demand for options: Heavy buying of options increases IV, while heavy selling reduces it.
Time to expiration: Longer-duration options usually have higher IV due to greater uncertainty over time.
Earnings or corporate events: Stocks often show rising IV ahead of quarterly earnings announcements.
2. Interpreting Implied Volatility
High IV Environment:
When IV is high, option premiums are expensive. This generally indicates:
Traders expect significant movement (up or down).
Fear or uncertainty is present in the market.
Volatility sellers (option writers) might see an opportunity to sell overpriced options.
For example, before major events like the Union Budget or RBI policy meeting, IV in Nifty options typically spikes due to the anticipated market reaction.
Low IV Environment:
When IV is low, option premiums are cheaper. This usually means:
The market expects calm or limited movement.
Traders may be complacent.
Volatility buyers might see an opportunity to buy options cheaply before an expected rise in volatility.
Implied Volatility Rank (IVR) and IV Percentile:
IV Rank compares current IV to its range over the past year.
Example: An IV Rank of 80 means current IV is higher than 80% of the past year’s readings.
IV Percentile shows the percentage of time IV has been below current levels.
Both help traders decide if options are cheap or expensive relative to history.
3. Understanding Open Interest (OI)
Open Interest represents the total number of outstanding option or futures contracts that are currently open (not yet closed, exercised, or expired). It indicates the total participation or liquidity in a particular strike or contract.
For example, if a trader buys 1 Nifty 22000 Call and another trader sells it, OI increases by one contract. If later that position is closed, OI decreases by one.
Key Aspects of OI:
Rising OI with rising prices = new money entering the market (bullish).
Rising OI with falling prices = fresh short positions (bearish).
Falling OI with rising or falling prices = unwinding of positions (profit booking or exit).
Stable OI = sideways or consolidating market.
4. How to Read Open Interest Data
OI and Price Relationship:
Price Trend OI Trend Market Interpretation
↑ Price ↑ OI Long build-up (bullish)
↓ Price ↑ OI Short build-up (bearish)
↑ Price ↓ OI Short covering (bullish)
↓ Price ↓ OI Long unwinding (bearish)
For example, if Nifty futures rise by 150 points and OI increases, traders are opening new long positions, suggesting bullishness. But if prices rise while OI falls, short positions are being covered.
5. Using OI in Option Chain Analysis
In options trading, OI is especially useful for identifying support and resistance zones.
High Call OI indicates a potential resistance level because sellers expect the price to stay below that strike.
High Put OI indicates a potential support level because sellers expect the price to stay above that strike.
For instance:
If Nifty has maximum Call OI at 22500 and maximum Put OI at 22000, traders consider this as a range of consolidation (22000–22500).
A breakout above 22500 or breakdown below 22000 with sharp OI changes can signal a shift in trend.
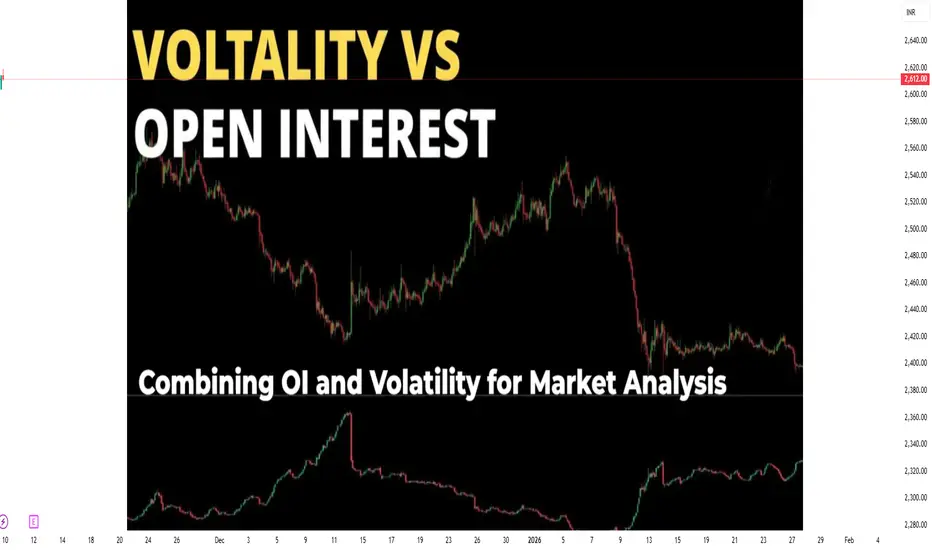
6. Combining IV and OI for Better Insights
Using IV and OI together gives a more complete picture of the market’s mindset.
Scenario 1: Rising IV + Rising OI
Indicates strong speculative activity.
Traders expect big moves, either due to events or upcoming volatility.
Suitable for straddle or strangle buyers.
Scenario 2: Falling IV + Rising OI
Implies calm market conditions with new positions being built.
Traders expect limited movement.
Suitable for option writing strategies (like Iron Condor, Short Straddle).
Scenario 3: Rising IV + Falling OI
Suggests short covering or unwinding due to fear.
Market participants are closing existing positions amid uncertainty.
Scenario 4: Falling IV + Falling OI
Indicates profit booking after a volatile phase.
Usually happens in post-event consolidation.
7. Practical Example: Nifty Option Chain Analysis
Suppose the Nifty 50 index is trading around 22,300.
Strike Call OI Put OI IV (Call) IV (Put)
22,000 4.8 L 6.2 L 15% 16%
22,300 5.5 L 5.1 L 17% 18%
22,500 7.8 L 3.9 L 20% 17%
Here:
Maximum Call OI at 22,500 → Resistance zone.
Maximum Put OI at 22,000 → Support zone.
IV is rising across strikes → traders expect upcoming volatility.
If price moves above 22,500 and Call writers exit (OI drops), while new Put OI builds, it signals a bullish breakout.
8. Role of IV and OI in Strategy Selection
High IV Strategies (Volatile Market):
Buy Straddle or Strangle (expecting large movement)
Calendar Spread
Long Vega strategies
Low IV Strategies (Stable Market):
Iron Condor
Short Straddle
Covered Call
Credit Spreads
OI data helps traders identify which strikes to select for these strategies and where the market might reverse or consolidate.
9. Limitations of IV and OI Analysis
While powerful, both metrics have limitations:
IV can be misleading before major events; it reflects expectations, not certainty.
OI data is end-of-day in many cases, so intraday traders might miss rapid shifts.
Sharp OI changes might also result from rollovers or hedging adjustments, not directional bias.
Hence, traders must use IV and OI along with price action, volume, and trend indicators for confirmation.
10. Conclusion
Implied Volatility and Open Interest form the foundation of options market sentiment analysis.
IV tells us what the market expects to happen in terms of movement magnitude.
OI tells us how much participation or commitment traders have in the current trend.
Together, they reveal a deeper layer of market psychology—identifying whether traders are fearful, greedy, hedging, or speculating.
For successful trading, combining price action + IV + OI enables traders to forecast volatility cycles, confirm trends, and time their entries or exits effectively.
In essence, mastering IV and OI analysis empowers traders to read the invisible hand of market sentiment—a crucial skill for anyone in the derivatives market.
Implied Volatility is a metric derived from the market price of options that reflects the market’s expectations of future volatility in the price of the underlying asset. Unlike historical volatility, which measures past price fluctuations, IV is forward-looking—it tells us how much the market expects the asset to move in the future.
Key Characteristics of IV:
Expressed in percentage terms, showing the expected annualized movement in the underlying asset.
Does not predict direction—only the magnitude of expected price swings.
Higher IV means the market expects larger price movements (high uncertainty or fear).
Lower IV means smaller expected price movements (stability or complacency).
Factors Influencing Implied Volatility:
Market sentiment: During uncertainty or events like elections, budgets, or economic announcements, IV tends to rise.
Supply and demand for options: Heavy buying of options increases IV, while heavy selling reduces it.
Time to expiration: Longer-duration options usually have higher IV due to greater uncertainty over time.
Earnings or corporate events: Stocks often show rising IV ahead of quarterly earnings announcements.
2. Interpreting Implied Volatility
High IV Environment:
When IV is high, option premiums are expensive. This generally indicates:
Traders expect significant movement (up or down).
Fear or uncertainty is present in the market.
Volatility sellers (option writers) might see an opportunity to sell overpriced options.
For example, before major events like the Union Budget or RBI policy meeting, IV in Nifty options typically spikes due to the anticipated market reaction.
Low IV Environment:
When IV is low, option premiums are cheaper. This usually means:
The market expects calm or limited movement.
Traders may be complacent.
Volatility buyers might see an opportunity to buy options cheaply before an expected rise in volatility.
Implied Volatility Rank (IVR) and IV Percentile:
IV Rank compares current IV to its range over the past year.
Example: An IV Rank of 80 means current IV is higher than 80% of the past year’s readings.
IV Percentile shows the percentage of time IV has been below current levels.
Both help traders decide if options are cheap or expensive relative to history.
3. Understanding Open Interest (OI)
Open Interest represents the total number of outstanding option or futures contracts that are currently open (not yet closed, exercised, or expired). It indicates the total participation or liquidity in a particular strike or contract.
For example, if a trader buys 1 Nifty 22000 Call and another trader sells it, OI increases by one contract. If later that position is closed, OI decreases by one.
Key Aspects of OI:
Rising OI with rising prices = new money entering the market (bullish).
Rising OI with falling prices = fresh short positions (bearish).
Falling OI with rising or falling prices = unwinding of positions (profit booking or exit).
Stable OI = sideways or consolidating market.
4. How to Read Open Interest Data
OI and Price Relationship:
Price Trend OI Trend Market Interpretation
↑ Price ↑ OI Long build-up (bullish)
↓ Price ↑ OI Short build-up (bearish)
↑ Price ↓ OI Short covering (bullish)
↓ Price ↓ OI Long unwinding (bearish)
For example, if Nifty futures rise by 150 points and OI increases, traders are opening new long positions, suggesting bullishness. But if prices rise while OI falls, short positions are being covered.
5. Using OI in Option Chain Analysis
In options trading, OI is especially useful for identifying support and resistance zones.
High Call OI indicates a potential resistance level because sellers expect the price to stay below that strike.
High Put OI indicates a potential support level because sellers expect the price to stay above that strike.
For instance:
If Nifty has maximum Call OI at 22500 and maximum Put OI at 22000, traders consider this as a range of consolidation (22000–22500).
A breakout above 22500 or breakdown below 22000 with sharp OI changes can signal a shift in trend.
6. Combining IV and OI for Better Insights
Using IV and OI together gives a more complete picture of the market’s mindset.
Scenario 1: Rising IV + Rising OI
Indicates strong speculative activity.
Traders expect big moves, either due to events or upcoming volatility.
Suitable for straddle or strangle buyers.
Scenario 2: Falling IV + Rising OI
Implies calm market conditions with new positions being built.
Traders expect limited movement.
Suitable for option writing strategies (like Iron Condor, Short Straddle).
Scenario 3: Rising IV + Falling OI
Suggests short covering or unwinding due to fear.
Market participants are closing existing positions amid uncertainty.
Scenario 4: Falling IV + Falling OI
Indicates profit booking after a volatile phase.
Usually happens in post-event consolidation.
7. Practical Example: Nifty Option Chain Analysis
Suppose the Nifty 50 index is trading around 22,300.
Strike Call OI Put OI IV (Call) IV (Put)
22,000 4.8 L 6.2 L 15% 16%
22,300 5.5 L 5.1 L 17% 18%
22,500 7.8 L 3.9 L 20% 17%
Here:
Maximum Call OI at 22,500 → Resistance zone.
Maximum Put OI at 22,000 → Support zone.
IV is rising across strikes → traders expect upcoming volatility.
If price moves above 22,500 and Call writers exit (OI drops), while new Put OI builds, it signals a bullish breakout.
8. Role of IV and OI in Strategy Selection
High IV Strategies (Volatile Market):
Buy Straddle or Strangle (expecting large movement)
Calendar Spread
Long Vega strategies
Low IV Strategies (Stable Market):
Iron Condor
Short Straddle
Covered Call
Credit Spreads
OI data helps traders identify which strikes to select for these strategies and where the market might reverse or consolidate.
9. Limitations of IV and OI Analysis
While powerful, both metrics have limitations:
IV can be misleading before major events; it reflects expectations, not certainty.
OI data is end-of-day in many cases, so intraday traders might miss rapid shifts.
Sharp OI changes might also result from rollovers or hedging adjustments, not directional bias.
Hence, traders must use IV and OI along with price action, volume, and trend indicators for confirmation.
10. Conclusion
Implied Volatility and Open Interest form the foundation of options market sentiment analysis.
IV tells us what the market expects to happen in terms of movement magnitude.
OI tells us how much participation or commitment traders have in the current trend.
Together, they reveal a deeper layer of market psychology—identifying whether traders are fearful, greedy, hedging, or speculating.
For successful trading, combining price action + IV + OI enables traders to forecast volatility cycles, confirm trends, and time their entries or exits effectively.
In essence, mastering IV and OI analysis empowers traders to read the invisible hand of market sentiment—a crucial skill for anyone in the derivatives market.
I built a Buy & Sell Signal Indicator with 85% accuracy.
📈 Get access via DM or
WhatsApp: wa.link/d997q0
Contact - +91 76782 40962
| Email: techncialexpress@gmail.com
| Script Coder | Trader | Investor | From India
📈 Get access via DM or
WhatsApp: wa.link/d997q0
Contact - +91 76782 40962
| Email: techncialexpress@gmail.com
| Script Coder | Trader | Investor | From India
Publikasi terkait
Pernyataan Penyangkalan
Informasi dan publikasi ini tidak dimaksudkan, dan bukan merupakan, saran atau rekomendasi keuangan, investasi, trading, atau jenis lainnya yang diberikan atau didukung oleh TradingView. Baca selengkapnya di Ketentuan Penggunaan.